

Use DeepSeek to plan data analysis, draft pandas and SQL, interpret verified results, and build safer CSV, Excel, and structured-output workflows. Last verified: July 28, 2026.
DeepSeek for Data Analysis can help analysts explore datasets, summarize CSV or Excel files, generate SQL and Python code, reason through business questions, create structured outputs, and turn raw findings into readable reports. But it should not be treated as a magic calculator. For exact numbers, regulated decisions, financial reporting, medical analysis, or sensitive datasets, you still need validation, reproducible tools such as Python, SQL, Excel, or BI software, and strong privacy controls.
DeepSeek is most useful when you use it as an analytical assistant: let it plan, explain, draft code, suggest checks, and summarize results. Let deterministic tools execute the calculations.
What You Can Do
Use DeepSeek to define metrics, inspect a small dataset, calculate descriptive results, flag anomalies, propose validation code, and translate findings into decision-ready language. Calculations and business conclusions should be independently reproduced before use.
Required Inputs
- A synthetic 12-row sales dataset with a documented schema, units, time zone, currency, and seeded anomalies.
- Clear metric definitions, filters, comparison periods, and rules for missing, duplicated, or invalid values.
- The business questions, expected output format, and decisions the analysis may inform.
- A calculation sheet or script containing the reference answers used to score the model.
Step-by-Step Workflow
- Document the schema, grain, metric definitions, and known data-quality rules.
- Ask the model to profile the data and list assumptions before calculating results.
- Generate metrics, anomaly findings, and decision notes with row-level evidence.
- Request reproducible Python or SQL that implements the same definitions.
- Run the code independently and reconcile every discrepancy before publishing a conclusion.
Tested Prompt
You are completing a reproducible synthetic data-analysis benchmark. Use only the CSV below. Do not browse. Do not silently repair data or invent business context. Answer in no more than 850 words.

Definitions:
- net_revenue = revenue - refunds
- channel ROAS = SUM(net_revenue) / SUM(ad_spend)
- Report results first on the raw table, then on a version with only exact duplicate rows removed.
- Never divide by zero at row level; flag the case instead.

CSV:
row,date,region,channel,orders,revenue,refunds,ad_spend
1,2026-01-05,East,Web,10,1000,50,200
2,2026-01-12,West,Partner,8,800,0,100
3,2026-02-02,East,Web,12,1200,100,240
4,2026-02-02,East,Web,12,1200,100,240
5,2026-02-09,West,Web,7,700,50,140
6,2026-02-16,East,Partner,6,900,0,150
7,2026-03-01,West,Web,5,400,500,120
8,2026-03-08,East,Web,9,990,90,180
9,2026-03-15,West,Partner,4,600,0,0
10,2026-03-22,East,Partner,11,1100,100,220
11,2026-03-22,West,Web,-2,300,0,60
12,2026-03-29,East,Web,8,880,80,160

Return exactly:
1. ISSUE INVENTORY — identify exactly four seeded data-quality issues with row numbers; distinguish one duplicate pair from row-level issues.
2. VERIFIED METRICS — show raw total net revenue; de-duplicated total net revenue; de-duplicated net revenue by region and month; and de-duplicated channel ROAS rounded to two decimals. Show the arithmetic or group totals used.
3. INTERPRETATION — exactly three statements labeled FACT, INFERENCE, or UNKNOWN. Do not call anomalies business trends.
4. PANDAS CODE — executable code that creates net_revenue, preserves a raw copy, removes only exact duplicates, safely calculates requested metrics, and outputs a QA report. Do not overwrite the source file.
5. VERIFICATION CHECKLIST — checks an analyst should run before publishing.

The four issues are deliberately present. Keep the refund-greater-than-revenue row, zero-ad-spend row, and negative-orders row in de-duplicated calculations unless a human-approved rule says otherwise.
Example Output
Live-test excerpt: The answer reported raw net revenue of 9,000 and de-duplicated net revenue of 7,900. It flagged row 7 because refunds (500) exceeded revenue (400), producing net revenue of −100. Its FACT statement attributed the 1,100 difference to one duplicate business record. That attribution matches the original reference’s intended rule of excluding the row identifier; the prompt did not state that rule explicitly. See the protocol clarification below.
Original Test Results
Original test run: July 29, 2026 · DeepSeek Chat · Instant mode · Synthetic English-only data · No web search.
| Measure | Result |
|---|---|
| Seeded data-quality issues found | 4/4 |
| Requested prose metrics matching the reference | 10/10 |
| Fact, inference, and unknown labels | 3/3 |
| Generated-code checks | 3/5 |
| False-positive anomalies | 0 |
| Overall rubric result | 25/27 (92.6%) |
Protocol clarification — September 4, 2026: The original prompt requests “only exact duplicate rows removed,” but rows 3 and 4 have different values in the row column. The pandas documentation states that drop_duplicates() considers all columns by default. With row retained as a column, the reported generated code therefore keeps both records and produces 9,000; the original reference total of 7,900 assumes a business duplicate key that excludes that identifier. The prompt’s separate instruction to find one duplicate pair does not define that key unambiguously.
The original prompt, reported outputs, and rubric result of 25/27 (92.6%) remain unchanged as a historical record. Because the duplicate-key rule was underspecified, the affected de-duplication and generated-code checks are not clean evidence of a model-only failure. For a new test, declare the exact duplicate-key columns and the reference calculation before running it; in operational data, obtain the data owner’s approval before excluding an identifier or removing a record.
Verification Checklist
- Recalculate every published metric in an independent spreadsheet, SQL query, or script.
- Confirm grain, units, currencies, time zones, date boundaries, filters, duplicates, and missing-value rules.
- Trace anomaly findings to row IDs and distinguish bad data from legitimate outliers.
- Run and review generated code in a safe environment with fixed package versions and tests.
- Separate measured facts from inferences and business recommendations.
Limitations
DeepSeek can make arithmetic, filtering, grouping, or unit errors and may produce code that looks plausible but does not reproduce the prose result. A small synthetic benchmark does not establish reliability on larger, noisier, regulated, or decision-critical datasets.
Related Solution
For controlled deployment, data governance, and repeatable organizational workflows, see DeepSeek Enterprise AI.
Quick Answer: Can You Use DeepSeek for Data Analysis?
Yes. You can use DeepSeek for data analysis when you need help understanding a dataset, planning an analysis, writing SQL, generating pandas code, interpreting patterns, explaining charts, or preparing an executive summary.
The safest workflow is:
DeepSeek creates the analysis plan → Python, SQL, Excel, or BI tools execute the calculations → DeepSeek helps explain the verified results.
That approach gives you the speed of AI assistance without relying on the model alone for exact, auditable numbers.
Table of Contents
What Is DeepSeek for Data Analysis?
DeepSeek is an AI model and API ecosystem that can assist with analytical reasoning, code generation, data interpretation, structured outputs, and reporting. In a data workflow, that means you can ask it to help you understand a dataset, propose metrics, write SQL, generate Python/pandas code, identify possible anomalies, explain results, or draft a business-facing summary.
API status verified September 24, 2026: DeepSeek’s official model list shows deepseek-flash (DeepSeek-V4.1-Flash) and deepseek-v4-pro. Both support JSON Output and Tool Calls. The announced cutoff for deepseek-chat and deepseek-reasoner has passed, so analytics examples should use an explicit V4 model ID.
For data analysis, the practical value is not that DeepSeek replaces your analytics stack. The value is that it can reduce friction between a business question and a working analytical method.
For example, instead of starting with a blank notebook, you can ask DeepSeek:
- What analysis should I run?
- Which columns should I clean first?
- What SQL query would answer this question?
- What pandas code would group this dataset by month and region?
- What chart would best explain this trend to executives?
- What validation checks should I perform before trusting the result?
That makes DeepSeek useful for analysts who want faster thinking, clearer documentation, and more repeatable workflows.
What DeepSeek Can and Cannot Do with Data
DeepSeek is strong at language, reasoning, planning, code drafting, summarization, and structured explanation. It is weaker when users expect it to be a guaranteed calculation engine without external verification.
| Task | Good Use Case | Risk / Limit | Best Practice |
|---|---|---|---|
| Exploratory data analysis | Ask for an analysis plan, likely metrics, segmentation ideas, and questions to investigate | The model may miss domain-specific context or suggest irrelevant cuts | Provide the schema, business goal, and metric definitions |
| CSV / Excel summarization | Summarize columns, identify possible trends, explain fields, and propose cleaning steps | Direct file capabilities vary by interface; large or messy files may be misunderstood | Share a safe sample, schema, and summary statistics |
| SQL query generation | Draft queries for joins, aggregations, filters, cohorts, and time periods | Generated SQL may not match your database dialect or table relationships | Test queries on a small sample and review joins carefully |
| Python / pandas code generation | Generate code for loading data, cleaning columns, grouping, plotting, and exporting results | Code may fail due to column names, data types, or library versions | Run code locally and debug before using results |
| Chart recommendations | Recommend chart types based on audience and message | It may suggest decorative charts instead of decision-friendly visuals | State the audience, question, and comparison type |
| Anomaly / outlier explanation | Suggest possible reasons for unusual values or spikes | It may imply causation without evidence | Treat explanations as hypotheses, not conclusions |
| Financial or regulated analysis | Draft a framework or checklist | High risk if used for decisions without validation | Require expert review, audit trails, and deterministic calculations |
| Sensitive / private data | Help design anonymized workflows | Public chat inputs may expose confidential information depending on configuration | Use data minimization, anonymization, approved tools, and legal review |
A helpful rule: use DeepSeek to improve your analysis process, not to remove your responsibility for the analysis.
Using DeepSeek for Data Analysis: Step-by-Step Workflow
The best way to use DeepSeek is to separate planning, execution, validation, and communication. That prevents the common mistake of asking an AI model for final answers before the dataset has been properly cleaned and checked.
The following infographic summarizes the safest way to use DeepSeek for data analysis. Instead of asking the model to produce final numbers directly, use it to plan the analysis, generate code or formulas, validate the output in deterministic tools, and then explain the verified findings.
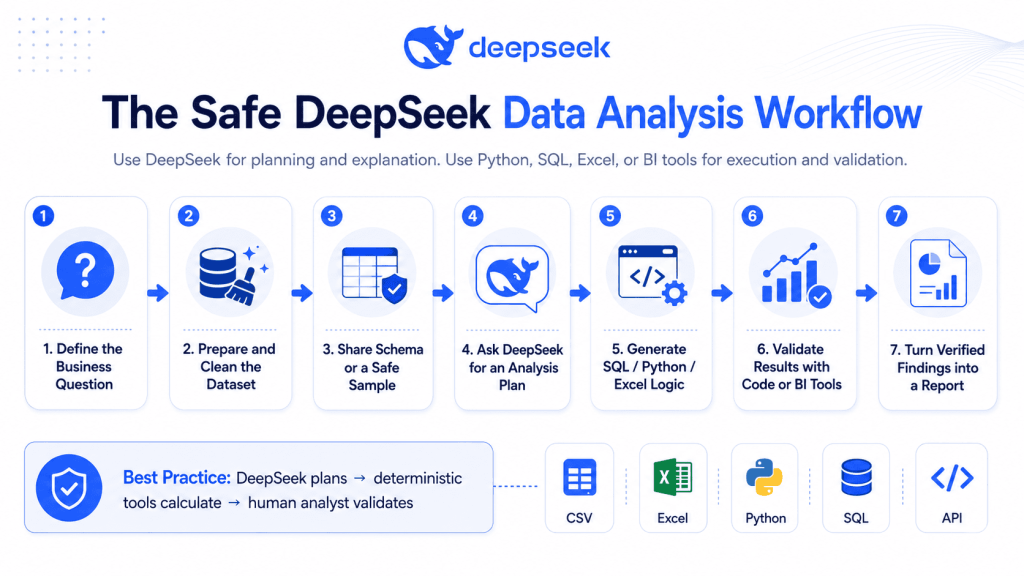
The recommended DeepSeek data analysis workflow: plan with AI, execute with deterministic tools, validate results, and report verified findings.
Step 1: Define the Business Question
Start with a specific question. Weak questions produce weak analysis.
Poor prompt:
Analyze this sales data.Better prompt:
I want to understand why monthly revenue dropped in Q3.
Analyze the dataset by region, product category, customer segment, and discount level.
Focus on revenue, units sold, average order value, and gross margin.
A clear question tells DeepSeek which metrics matter and which patterns are worth investigating.
Step 2: Prepare and Clean the Dataset
Before using any AI tool, clean obvious issues:
- Remove duplicate header rows.
- Use consistent date formats.
- Rename columns clearly.
- Remove empty rows and irrelevant notes.
- Confirm units, currencies, and time zones.
- Separate raw data from calculated fields.
Clean column names matter because models and code both rely on them. A column named rev_usd is easier to interpret than Column_12.
Step 3: Share Schema or a Safe Sample
Do not paste sensitive data by default. Instead, share:
- Column names
- Data types
- Row count
- Sample rows with anonymized values
- Metric definitions
- Known issues
- Business context
Example:
Dataset description:
- 48,000 rows
- One row per order
- Date range: January 2025 to December 2025
- Columns: order_id, order_date, region, product_category, customer_segment, revenue_usd, discount_pct, gross_margin_usd
- Business question: Why did revenue drop in Q3?
Step 4: Ask for an Analysis Plan
Before asking for code, ask DeepSeek to propose a plan.
Act as a senior data analyst.
Given this dataset schema and business question, create a step-by-step analysis plan.
Include:
1. Data quality checks
2. Metrics to calculate
3. Segments to compare
4. Possible visualizations
5. Validation checks
6. Risks or assumptions
This makes the model more useful because it has to reason about the task before generating outputs.
Step 5: Generate SQL, Python, or Excel Logic
After approving the plan, ask for the execution logic.
For Python:
Write pandas code to answer the analysis plan.
Use clear variable names.
Include checks for missing values, duplicate order IDs, date parsing, and grouped revenue by month, region, and product category.
For SQL:
Write a PostgreSQL query to calculate monthly revenue, units sold, average order value, and gross margin by region and product category.
Assume the table is called orders.
For Excel:
Suggest Excel formulas and pivot table settings to calculate monthly revenue by region and category.
Explain each step for a non-technical analyst.
Step 6: Validate Results Manually or with Code
Do not accept the first output as final. Check row counts, totals, missing values, joins, filters, and calculations.
For CSV workflows, pandas is a strong validation layer. Its read_csv() function reads CSV files into DataFrames, describe() generates descriptive statistics, and isna() helps detect missing values.
Step 7: Turn Findings into a Report or Dashboard
Once the numbers are verified, DeepSeek can help with communication:
Turn these verified findings into a concise executive summary.
Audience: VP of Sales.
Tone: clear, direct, non-technical.
Include:
- 3 key findings
- 2 likely causes
- 3 recommended actions
- 1 caveat about data limitations
This is where DeepSeek often shines: not in replacing analysis, but in making the final insight easier to understand.
How to Use DeepSeek with CSV and Excel Files
CSV and Excel workflows are the most common starting point for AI-assisted analysis. Depending on the interface you use, you may upload documents or provide dataset summaries; DeepSeek’s chat page describes file reading and document upload capabilities, while the API workflow is better handled by sending schema, samples, and computed summaries instead of raw files whenever possible.
Prepare the File First
Before asking DeepSeek to analyze a spreadsheet:
- Make one row equal one record.
- Use one header row.
- Remove merged cells.
- Avoid blank columns between data columns.
- Use clear column names.
- Convert dates to a consistent format.
- Separate notes from the actual data table.
- Remove personally identifiable information unless you have approval.
Provide Metadata
DeepSeek performs better when it understands what the data represents.
Include:
File type: CSV
Rows: 12,540
Date range: 2025-01-01 to 2025-12-31
Unit of analysis: one row per customer order
Currency: USD
Key metrics: revenue_usd, gross_margin_usd, discount_pct
Main question: Which factors explain the Q3 revenue decline?
Ask Natural-Language Questions
Good questions include the metric, dimension, time period, and desired output.
Examples:
Which product categories had the largest revenue decline from Q2 to Q3?Compare average order value by customer segment across each quarter.Identify regions where discounting increased but revenue did not improve.Suggest three charts that would help explain this dataset to a sales leadership team.Do Not Rely on the Model Alone for Exact Computations
If the answer matters, run the calculations in Excel, SQL, Python, or your BI tool. DeepSeek can generate the formula or code, but the calculation should be executed in a deterministic environment.
DeepSeek Prompt Templates for Data Analysis
Below are reusable prompt templates. Replace the placeholders with your dataset details.
1. Dataset Understanding Prompt
Act as a senior data analyst.

I have a dataset with this description:
[dataset description]

Columns:
[columns]

Business context:
[context]

Explain:
1. What each column likely represents
2. Which columns are dimensions and which are metrics
3. What data quality issues I should check
4. What questions this dataset can answer
5. What questions it cannot answer without additional data
2. Exploratory Data Analysis Prompt
Act as a data analyst performing exploratory data analysis.

Dataset:
[dataset description]

Columns:
[columns]

Business question:
[business question]

Create an EDA plan that includes:
- Row count checks
- Missing value checks
- Duplicate checks
- Descriptive statistics
- Segment comparisons
- Time-based analysis
- Outlier checks
- Recommended visualizations
- Validation steps
3. Data Cleaning Prompt
Act as a data cleaning specialist.

Dataset:
[dataset description]

Columns and sample values:
[columns and sample values]

Identify likely data cleaning issues, including:
- Missing values
- Duplicate records
- Inconsistent date formats
- Inconsistent categories
- Invalid numeric values
- Outliers that need review

Return a cleaning checklist and suggested Python/pandas steps.
4. Outlier Detection Prompt
Act as a statistical analyst.

Dataset:
[dataset description]

Numeric columns:
[numeric columns]

Business question:
[business question]

Suggest an outlier detection approach.
Include:
1. Which columns to check
2. Which statistical methods to use
3. Which outliers may be valid business events
4. Which outliers may be data errors
5. Python/pandas code to flag records for review
5. SQL Generation Prompt
Act as a SQL analyst.

Database dialect:
[PostgreSQL / MySQL / BigQuery / SQL Server]

Table name:
[table name]

Schema:
[table schema]

Business question:
[business question]

Write a SQL query that answers the question.
Requirements:
- Use clear aliases
- Include date filtering
- Avoid unnecessary joins
- Explain the logic
- Mention assumptions
- Add validation queries for row counts and totals
6. pandas Analysis Prompt
Act as a Python data analyst.

Dataset:
[dataset description]

CSV file name:
[file name]

Columns:
[columns]

Business question:
[business question]

Write pandas code to:
1. Load the CSV
2. Validate row counts
3. Check missing values
4. Convert date columns
5. Calculate the required metrics
6. Group results by relevant dimensions
7. Export a summary table
8. Suggest charts
7. Excel Formula Explanation Prompt
Act as an Excel analytics coach.

Dataset:
[dataset description]

Columns:
[columns]

Task:
[task]

Explain how to complete this analysis in Excel using:
- Pivot tables
- Formulas
- Filters
- Conditional formatting
- Charts

Keep the explanation beginner-friendly and include example formulas.
8. Visualization Recommendation Prompt
Act as a data visualization expert.

Dataset:
[dataset description]

Business question:
[business question]

Audience:
[audience]

Recommend the best charts for this analysis.
For each chart, explain:
1. What it shows
2. Why it is appropriate
3. Which fields to use
4. What mistakes to avoid
5. How to title it clearly
9. Executive Summary Prompt
Act as a business analyst writing for executives.

Verified analysis results:
[verified results]

Audience:
[audience]

Write an executive summary with:
- 3 key findings
- 2 business implications
- 3 recommended actions
- 1 data limitation
- A concise title
Use clear, non-technical language.
10. Validation and QA Prompt
Act as a data quality reviewer.

Analysis goal:
[business question]

Dataset:
[dataset description]

Method used:
[SQL / Python / Excel / BI tool]

Results:
[results]

Create a validation checklist.
Include:
- Row count checks
- Missing value checks
- Duplicate checks
- Metric formula checks
- Filter checks
- Join checks
- Edge cases
- Assumptions
- Questions to ask before publishing
Reusable DeepSeek SQL context template
You are helping me with SQL analysis.

Database dialect:
[PostgreSQL / MySQL / SQL Server / DuckDB / BigQuery / Snowflake / other]

Business question:
[Write the exact business question]

Relevant tables:
[table_name]: [short description]
- column_name: [type, meaning, nullable?]
- column_name: [type, meaning, nullable?]

Relationships:
- [table_a.column] joins to [table_b.column]
- Relationship type: [one-to-one / one-to-many / many-to-many]

Business definitions:
- [metric name] = [definition]
- [status meaning] = [definition]

Filters:
- [date range]
- [statuses]
- [regions]
- [segments]

Expected output:
- Columns:
- Grain:
- Sorting:
- Limit:

Constraints:
- Use read-only SELECT statements only.
- Do not generate INSERT, UPDATE, DELETE, DROP, ALTER, TRUNCATE, CREATE, MERGE, CALL, COPY, GRANT, REVOKE, EXECUTE, or any multi-statement SQL.
- State assumptions separately.
- Explain possible edge cases.
- Include validation checks.

Output format:
1. SQL
2. Explanation
3. Assumptions
4. Validation checklist
5. Performance notes
Practical Example: Analyzing a Sales Dataset with DeepSeek
This example uses fictional data. It is designed to show the workflow, not to claim real-world results.
Dataset Schema
| Column | Type | Description |
|---|---|---|
| order_id | string | Unique order identifier |
| order_date | date | Date of purchase |
| region | string | Sales region |
| product_category | string | Product category sold |
| customer_segment | string | SMB, Mid-Market, or Enterprise |
| units_sold | integer | Number of units sold |
| revenue_usd | float | Order revenue in USD |
| discount_pct | float | Discount percentage |
| gross_margin_usd | float | Gross margin in USD |
Business Question
Why did revenue decline in Q3, and which region or product category contributed the most?
DeepSeek Prompt
Act as a senior sales data analyst.

I have a fictional sales dataset with one row per order.

Schema:
- order_id: unique order ID
- order_date: purchase date
- region: sales region
- product_category: product category
- customer_segment: SMB, Mid-Market, Enterprise
- units_sold: units sold
- revenue_usd: order revenue
- discount_pct: discount percentage
- gross_margin_usd: gross margin

Business question:
Why did revenue decline in Q3, and which region or product category contributed the most?

Create:
1. A data quality checklist
2. An analysis plan
3. pandas code
4. Recommended charts
5. Validation checks
6. A short executive summary template
Expected Analysis Plan
DeepSeek should propose something like this:
- Confirm row count and unique order IDs.
- Parse
order_dateand create quarter/month columns. - Calculate total revenue by quarter.
- Compare Q2 vs Q3 revenue.
- Break the change down by region.
- Break the change down by product category.
- Compare average discount and gross margin.
- Check whether lower revenue came from fewer units, lower prices, higher discounts, or category mix.
- Validate totals against source data.
- Summarize findings for leadership.
Python / pandas Code Example
import os
import pandas as pd

# Load fictional sales data
csv_path = "fictional_sales_data.csv"
df = pd.read_csv(csv_path)

# Basic validation
print("Rows:", len(df))
print("Columns:", df.columns.tolist())
print("Duplicate order IDs:", df["order_id"].duplicated().sum())

# Missing values
missing = df.isna().sum().sort_values(ascending=False)
print("Missing values:")
print(missing)

# Date parsing
df["order_date"] = pd.to_datetime(df["order_date"], errors="coerce")
df["quarter"] = df["order_date"].dt.to_period("Q").astype(str)
df["month"] = df["order_date"].dt.to_period("M").astype(str)

# Revenue by quarter
quarterly_revenue = (
    df.groupby("quarter", as_index=False)
      .agg(
          revenue_usd=("revenue_usd", "sum"),
          units_sold=("units_sold", "sum"),
          gross_margin_usd=("gross_margin_usd", "sum"),
          avg_discount_pct=("discount_pct", "mean")
      )
      .sort_values("quarter")
)

print(quarterly_revenue)

# Compare Q2 and Q3
q2_q3 = df[df["quarter"].isin(["2025Q2", "2025Q3"])]

region_change = (
    q2_q3.groupby(["quarter", "region"], as_index=False)["revenue_usd"].sum()
)

region_pivot = (
    region_change
    .pivot(index="region", columns="quarter", values="revenue_usd")
    .reindex(columns=["2025Q2", "2025Q3"], fill_value=0)
)

region_pivot["change_q3_minus_q2"] = (
    region_pivot["2025Q3"] - region_pivot["2025Q2"]
)

q2_denominator = region_pivot["2025Q2"].where(
    region_pivot["2025Q2"] != 0
)
region_pivot["pct_change"] = (
    region_pivot["change_q3_minus_q2"] / q2_denominator
)

print(region_pivot.sort_values("change_q3_minus_q2"))

category_change = (
    q2_q3.groupby(["quarter", "product_category"], as_index=False)["revenue_usd"].sum()
)

category_pivot = (
    category_change.pivot(index="product_category", columns="quarter", values="revenue_usd")
    .fillna(0)
)

category_pivot["change_q3_minus_q2"] = category_pivot.get("2025Q3", 0) - category_pivot.get("2025Q2", 0)

print(category_pivot.sort_values("change_q3_minus_q2"))

# Export summaries
quarterly_revenue.to_csv("quarterly_revenue_summary.csv", index=False)
region_pivot.to_csv("region_q2_q3_revenue_change.csv")
category_pivot.to_csv("category_q2_q3_revenue_change.csv")
Example Interpretation
After running the analysis, you might provide DeepSeek with the verified summary tables and ask:
Here are the verified Q2 vs Q3 results from pandas:
[paste summary tables]

Write an executive summary.
Do not invent causes.
Separate confirmed findings from hypotheses.
Mention any data limitations.
A good interpretation might say:
Q3 revenue declined primarily because the West region and Hardware category contributed the largest absolute decreases. Units sold also decreased, while average discount increased, suggesting the decline was not caused by price increases alone. Further analysis should check campaign timing, stock availability, customer churn, and product mix before making causal claims.
Validation Checklist for This Example
- Confirm total revenue by quarter matches the raw file.
- Confirm
order_idis unique or understand why duplicates exist. - Check whether returns, refunds, or canceled orders are included.
- Confirm Q2 and Q3 date ranges.
- Check if revenue is net or gross.
- Compare units sold and discount percentage alongside revenue.
- Avoid claiming causation without additional evidence.
- Review the final interpretation with a sales or finance stakeholder.
Using DeepSeek API for Data Analysis Workflows
The API is better than chat when you need repeatability, structured outputs, automation, integration with internal systems, or programmatic control.
DeepSeek’s documentation shows API usage in an OpenAI-compatible format, and the current hosted API catalog includes deepseek-flash (DeepSeek-V4.1-Flash) and deepseek-v4-pro. Use Flash or Pro for text-only analytics prompts. deepseek-flash is the documented option for understanding supported images such as chart, dashboard, or table screenshots; it returns text and should not be described as spreadsheet or document ingestion. JSON Output is especially useful for analytics workflows because it can return structured JSON that downstream code can parse. DeepSeek’s documentation says JSON Output is designed for strict JSON responses and requires response_format plus a prompt that asks for JSON.
DeepSeek’s Files API currently accepts supported JPEG, PNG, GIF, and WebP images for reuse with deepseek-flash through a file_id; it is not a native CSV, XLSX, PDF, or general-document ingestion route. For structured datasets, keep loading and parsing the source in Python, SQL, Excel, or another approved client, then send only the necessary schema, summaries, or verified outputs to the model as this workflow already recommends.
Safer Architecture Pattern
Use this pattern:
User question
   ↓
Python loads and summarizes dataset
   ↓
DeepSeek creates JSON analysis plan
   ↓
Python / pandas executes calculations
   ↓
DeepSeek explains verified outputs
   ↓
Human analyst reviews final report
This matters because DeepSeek’s Tool Calls documentation notes that the model itself does not execute specific functions; the user must provide the actual function behavior. In other words, the model can decide that a calculation should run, but your code should run the calculation.
Python Example: DeepSeek as an Analysis Planner
import os
import json
import pandas as pd
from openai import OpenAI

# Always check the latest DeepSeek API docs before production use.
# Set your key in the environment:
# export DEEPSEEK_API_KEY="your_key_here"

client = OpenAI(
    api_key=os.environ["DEEPSEEK_API_KEY"],
    base_url="https://api.deepseek.com",
)

# Load data locally
df = pd.read_csv("sales_data.csv")

# Create a compact dataset summary instead of sending the full dataset
schema = {
    "columns": [{"name": col, "dtype": str(df[col].dtype)} for col in df.columns],
    "row_count": int(len(df)),
    "missing_values": {column: int(count) for column, count in df.isna().sum().items()},
}

prompt = f"""
You are a senior data analyst.

Return valid JSON only.

Dataset summary:
{json.dumps(schema, default=str)}

Business question:
Why did revenue decline in Q3?

Create an analysis plan with:
- required_checks
- metrics
- groupby_dimensions
- filters
- pandas_steps
- validation_steps
- chart_recommendations

Use this JSON structure:
{{
  "required_checks": [],
  "metrics": [],
  "groupby_dimensions": [],
  "filters": [],
  "pandas_steps": [],
  "validation_steps": [],
  "chart_recommendations": []
}}
"""

response = client.chat.completions.create(
    model="deepseek-flash",
    messages=[
        {
            "role": "system",
            "content": "You create safe, practical data analysis plans in JSON."
        },
        {
            "role": "user",
            "content": prompt
        }
    ],
    response_format={"type": "json_object"},
    max_tokens=1500,
    extra_body={"thinking": {"type": "disabled"}},
)

content = response.choices[0].message.content
if not content or not content.strip():
    raise RuntimeError("DeepSeek returned empty JSON content.")
try:
    analysis_plan = json.loads(content)
except json.JSONDecodeError as exc:
    raise RuntimeError("DeepSeek returned invalid JSON.") from exc
if not isinstance(analysis_plan, dict):
    raise RuntimeError("Expected a JSON object.")

print(json.dumps(analysis_plan, indent=2))
Implementation Notes
- Do not send sensitive raw data unless your organization has approved the deployment and data handling terms.
- Prefer summaries, schemas, samples, and aggregate tables.
- Execute the actual calculations in Python, SQL, Excel, or BI tools.
- Log prompts, code versions, and outputs for reproducibility.
- DeepSeek’s chat completion API is described as stateless, so multi-turn API workflows must pass the required conversation context with each request.
DeepSeek vs Manual Coding for Data Analysis
DeepSeek is valuable, but it is not always faster than writing code directly.
| Use DeepSeek When | Code Manually When |
|---|---|
| You need help forming an analytical approach | The task is simple and faster to write directly |
| You want SQL, Python, pandas, or Excel suggestions | Accuracy must be deterministic and auditable |
| You need summaries and explanations | You are building production-grade pipelines |
| You are exploring unfamiliar data | You handle sensitive, regulated, or confidential data |
| You want a validation checklist | You need full reproducibility and version control |
| You need to explain results to non-technical users | The analysis is already standardized |
A strong analyst uses both. DeepSeek can help you think faster, but manual code and verified tools give you control.
Common Data Issues DeepSeek Can Help Identify
DeepSeek is especially helpful for spotting patterns in messy samples and suggesting what to check next.
Hidden Nulls
Real-world datasets often contain hidden null values such as:
N/ANAnullNone-unknown- empty strings
- whitespace-only strings
DeepSeek can help identify these patterns and suggest a normalization strategy.
Duplicate Records
Duplicates can appear as:
- Exact duplicate rows.
- Duplicate IDs.
- Duplicate emails.
- Duplicate orders.
- Near-duplicates with minor spelling differences.
DeepSeek can suggest candidate keys and duplicate detection logic, but your code should calculate the actual duplicates.
Mixed Date Formats
A single date column may include:
2025-01-0501/05/20252025/01/052025-01-05T14:20:00Z- invalid dates such as
2025-13-01
DeepSeek can propose parsing rules, but your code should flag values that fail parsing.
Numeric Fields Stored as Strings
Examples:
"$129.99""1,250.00""N/A"" 89.50 "
A cleaning script may need to remove symbols, trim whitespace, handle thousands separators, and convert values to decimal types.
Category Variations
Examples:
completedCompletecompleteCOMPLETEDdone
DeepSeek can propose a mapping table, but the business should approve final category definitions.
Impossible Values
Examples:
- Negative order totals.
- Refunds larger than order totals.
- Signup dates in the future.
- Ages over 150.
- Quantities below zero.
- Percentages over 100.
Some impossible values are truly invalid. Others may represent credits, corrections, tests, or system migrations. Flag before deleting.
Cross-Column Contradictions
Examples:
order_status = completedbutorder_totalis missing.order_status = refundedbutrefund_amount = 0.signup_dateoccurs after the first order date.country = United Statesbut phone number country code is inconsistent.
DeepSeek can help generate cross-column checks that are easy to miss in basic profiling.
Encoding and Whitespace Problems
Examples:
- Leading spaces.
- Trailing spaces.
- Non-breaking spaces.
- Mojibake or broken encoding.
- Mixed casing.
- Invisible characters.
These issues are common in CSV and Excel exports.
How to Validate DeepSeek’s Data Analysis Results
Validation is the difference between an interesting AI-generated answer and a trustworthy analysis.
Use this checklist before publishing any result.
Data Integrity Checks
- Check total row count.
- Check duplicate records.
- Check missing values.
- Check invalid dates.
- Check impossible values, such as negative revenue unless returns are expected.
- Check inconsistent category names.
- Check whether filters excluded important records.
Calculation Checks
- Re-run calculations in Python, Excel, SQL, or a BI tool.
- Compare totals to the source system.
- Validate formulas for revenue, margin, conversion rate, churn, or retention.
- Check denominators in percentages.
- Confirm date ranges.
- Check groupings and joins.
Interpretation Checks
- Ask DeepSeek to list its assumptions.
- Separate facts from hypotheses.
- Never accept unsupported causal claims.
- Check whether results are statistically meaningful.
- Compare findings with domain knowledge.
- Ask a stakeholder whether the conclusion makes business sense.
Reproducibility Checks
- Save the prompt.
- Save the code.
- Save the dataset version.
- Save the output tables.
- Document any manual changes.
- Note limitations in the final report.
This aligns with a broader AI safety principle: avoid overreliance. OWASP lists overreliance on LLM outputs as a risk because unverified outputs can compromise decision-making and create legal or security problems.
Privacy, Security, and Sensitive Data
Do not paste confidential customer data, medical records, legal documents, financial statements, source code, employee information, or proprietary datasets into a public chat interface unless your organization has explicitly approved that use.
For safer workflows:
- Share only the schema when possible.
- Use anonymized sample rows.
- Aggregate data before sending it.
- Remove names, emails, phone numbers, addresses, account IDs, and other identifiers.
- Use internal or enterprise-approved deployments for sensitive use cases.
- Review provider terms, retention settings, and deployment architecture.
- Keep regulated decisions under human and expert review.
OWASP identifies sensitive information disclosure as a major LLM application risk because failure to protect sensitive information can lead to legal consequences or loss of competitive advantage.
Data Minimization Rule
Only give DeepSeek the minimum information needed to complete the analytical task.
For example, instead of sending a full customer table, send:
Customer segment counts:
- SMB: 8,420
- Mid-Market: 2,130
- Enterprise: 540

Churn rate by segment:
- SMB: 7.8%
- Mid-Market: 5.1%
- Enterprise: 3.4%

Question:
Explain the pattern and suggest follow-up analyses.
This keeps the analysis useful while reducing privacy exposure.
Common Mistakes When Using DeepSeek for Data Analysis
Mistake 1: Uploading Messy Data
If the spreadsheet has merged cells, repeated headers, blank rows, and unclear column names, the model may misunderstand it. Clean the structure first.
Mistake 2: Asking Broad Questions
“Analyze this data” is too vague. Ask a specific business question with metrics, dimensions, and output expectations.
Mistake 3: Trusting Generated Calculations Without Checking
Generated answers can be plausible but wrong. Always run calculations in a deterministic tool.
Mistake 4: Not Giving Schema or Context
DeepSeek cannot know your metric definitions unless you provide them. “Revenue” might mean gross revenue, net revenue, recognized revenue, or collected cash.
Mistake 5: Not Separating Planning from Execution
Ask for a plan first. Then ask for code. Then execute the code. Then ask for interpretation.
Mistake 6: Ignoring Privacy
Do not expose sensitive data just because the workflow is convenient.
Mistake 7: Asking for Charts Without Defining the Audience
A CFO, marketing manager, and operations analyst may need different visualizations for the same dataset.
Best Practices for Better DeepSeek Data Analysis Prompts
A strong prompt should include:
- Role: “Act as a senior data analyst.”
- Goal: “Find why Q3 revenue declined.”
- Dataset description: row count, time period, unit of analysis.
- Schema: column names and data types.
- Metric definitions: how revenue, margin, churn, or conversion are calculated.
- Constraints: tools, SQL dialect, Python version, Excel-only, no sensitive data.
- Output format: table, checklist, JSON, code, or executive summary.
- Validation requirements: row counts, totals, missing values, edge cases.
- Limitations: ask the model to state assumptions and risks.
Example:
Act as a senior data analyst.

Goal:
Find the main drivers of Q3 revenue decline.

Dataset:
One row per order, 42,000 rows, date range 2025-01-01 to 2025-12-31.

Columns:
order_id, order_date, region, product_category, customer_segment, units_sold, revenue_usd, discount_pct, gross_margin_usd

Metric definitions:
Revenue = revenue_usd
Gross margin = gross_margin_usd
Average order value = revenue_usd / unique order count

Output:
1. Analysis plan
2. pandas code
3. Validation checklist
4. Chart recommendations
5. Executive summary template

Do not invent results. If data is required, ask for it.
This prompt is much more likely to produce a useful result than a one-line request.
Is DeepSeek Good for Data Analysts?
Yes, DeepSeek can be a good assistant for data analysts, especially for planning, code drafting, SQL generation, documentation, summarization, and explaining insights. It is useful when you need to move quickly from a business question to an analytical approach.
However, it is not a replacement for:
- Clean data
- Statistical judgment
- Business context
- Reproducible pipelines
- Secure data handling
- Human review
- Domain expertise
The best analysts will use DeepSeek as a thinking and productivity layer, not as an unchecked source of truth.
FAQs
Can DeepSeek analyze Excel files?
DeepSeek can help analyze Excel-style data when you provide the file, a clean table, a schema, or a summarized sample, depending on the interface and workflow you use. For serious analysis, use DeepSeek to plan and explain, then verify calculations in Excel, Python, SQL, or BI tools.
Can DeepSeek analyze CSV files?
Yes. CSV files are a good fit for DeepSeek-assisted workflows because they are structured and easy to summarize. A safe API workflow is to load the CSV with Python, send DeepSeek the schema and summary, ask for a plan, run the calculations locally, and then ask DeepSeek to explain the verified results.
Is DeepSeek good for data analysis?
DeepSeek is good for exploratory analysis, code generation, SQL drafting, business summaries, data cleaning suggestions, and validation planning. It should not be used as the only source of truth for exact calculations or high-stakes decisions.
Can DeepSeek write SQL queries?
Yes. DeepSeek can draft SQL queries for aggregations, joins, filters, cohorts, and time-based analysis. Always specify your SQL dialect and validate the query against your actual schema before trusting the output.
Can DeepSeek generate Python code for data analysis?
Yes. DeepSeek can generate Python and pandas code for loading files, cleaning data, grouping metrics, detecting missing values, and exporting summaries. Run the code in your own environment and review the results carefully.
Is DeepSeek safe for sensitive data?
DeepSeek can be part of a safe workflow only when used with proper privacy controls. Do not paste confidential or regulated data into a public chat interface. Use anonymization, aggregation, internal approvals, and enterprise-grade controls where appropriate.
Can DeepSeek create charts and dashboards?
DeepSeek can recommend charts, write Python plotting code, suggest dashboard layouts, and explain chart choices. It is better to generate the actual chart in Python, Excel, Tableau, Power BI, or another visualization tool.
Is DeepSeek better than ChatGPT for data analysis?
Not universally. DeepSeek may be attractive for API-based planning, long-context workflows, structured outputs, and cost-sensitive automation. ChatGPT, according to OpenAI’s Help Center, can analyze uploaded files, answer questions about data, and create tables or charts; OpenAI also describes ChatGPT as able to run code in a secure environment for data analysis and visualization. The better choice depends on your interface, data policy, required accuracy, budget, and whether you need built-in code execution or a custom API workflow.
Conclusion
DeepSeek for Data Analysis is most effective when used as an analytical assistant rather than an unchecked calculator. It can help you plan an analysis, understand a dataset, generate SQL and Python code, create structured JSON plans, recommend charts, identify validation steps, and communicate findings clearly.
The best workflow is simple:
Use DeepSeek for planning, reasoning, code generation, and explanation. Use Python, SQL, Excel, or BI tools for deterministic execution and validation.
That combination gives you speed without sacrificing accuracy, privacy, or trust.