
Last tested: July 27, 2026. This DeepSeek Observability guide shows how to instrument production API calls with privacy-safe logs, OpenTelemetry traces, token and cache metrics, cost estimates, quality checks, dashboards, and incident alerts. It separates fields that DeepSeek actually returns from signals your application must calculate, so a plausible dashboard never masquerades as provider evidence.
We also ran an original, frozen eight-case study against the live DeepSeek API. Seven planned requests returned HTTP 200 and the expected invalid-model control returned HTTP 400. The most useful finding was not a perfect pass: a streamed response finished normally and included final usage, yet produced five words when the prompt required six. That is the central lesson of LLM observability—transport success, terminal completion, contract validity, product quality, safety, and cost are different measurements.
Quick answer: monitor every DeepSeek call at four layers: provider lifecycle, application contract, evaluated quality, and business outcome. Keep prompts, outputs, reasoning text, tool arguments, authorization headers, and raw error bodies out of default telemetry.
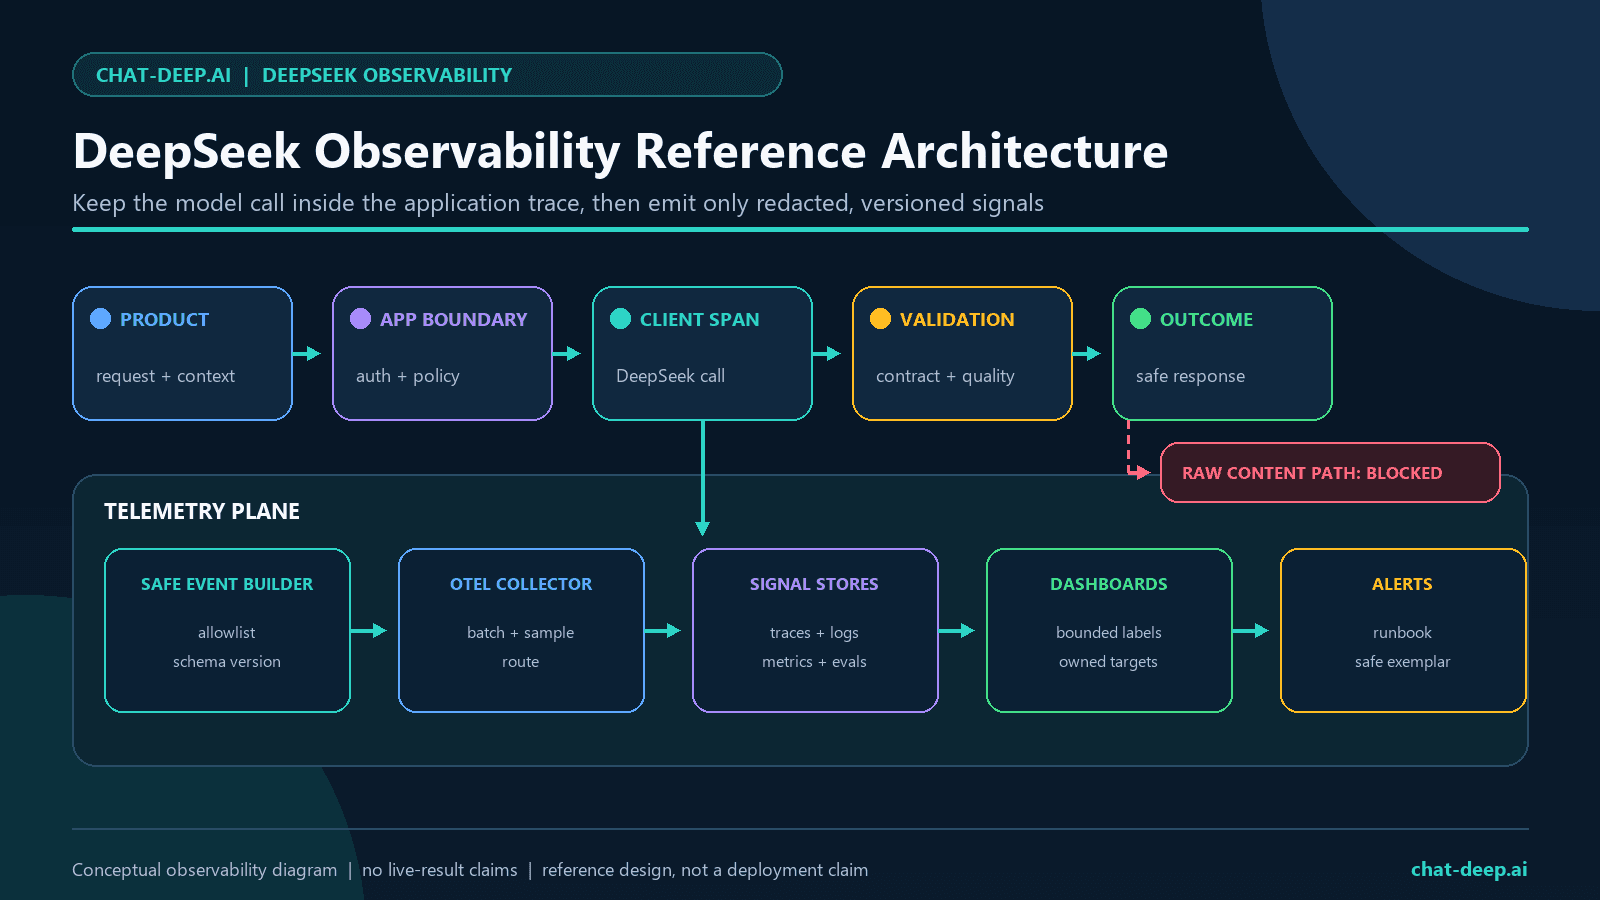
Table of Contents
- The minimum production signal set
- Reference architecture
- What the DeepSeek API actually returns
- OpenTelemetry mapping
- Privacy-safe logs
- Streaming observability
- Token, cache, and cost monitoring
- Quality and contract monitoring
- Thinking, tools, and agent traces
- Errors, retries, timeouts, and concurrency
- Dashboard and alert design
- Original live test results
- Implementation checklist
- FAQ
- Methodology and sources
DeepSeek Observability: The Minimum Production Signal Set
A useful DeepSeek monitoring implementation starts with questions, not a vendor dashboard. Can you tell whether the provider accepted the request, whether the response reached a valid terminal state, whether your parser accepted it, whether the answer satisfied the task, and what the request cost? If any answer is missing, the system is only partially observable.
| Question | Minimum signal | Source of truth | Do not confuse it with |
|---|---|---|---|
| Did the call complete? | Status, timeout state, cancellation state, finish_reason | Transport and DeepSeek response | Answer quality |
| Was streaming responsive? | First response-stream chunk, first parsed event, first content, total duration, terminal usage | Application clock and stream parser | A provider SLA |
| What was consumed? | Input, output, cache-hit, cache-miss, and reasoning tokens | DeepSeek usage | Character counts |
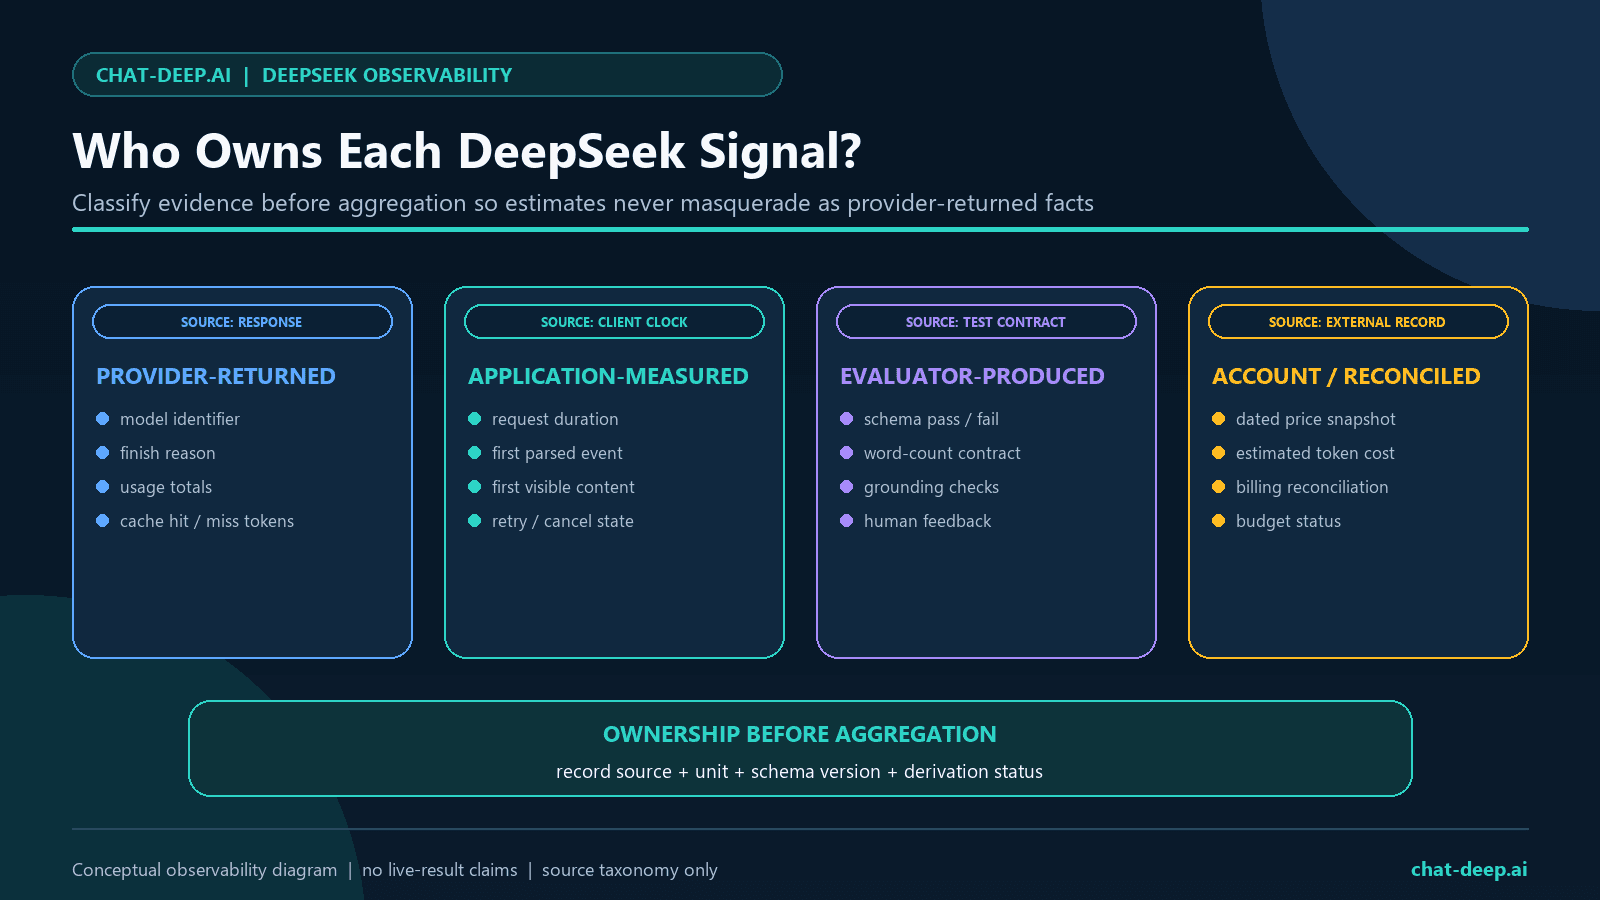
| What did it cost? | Usage multiplied by a dated price snapshot | Application calculation plus billing reconciliation | A field returned by Chat Completions |
| Was the contract valid? | JSON schema, tool schema, citation, or format check | Application validator | HTTP 200 |
| Was the answer useful? | Task-specific evaluator, human feedback, and business outcome | Evaluation pipeline | Model confidence or fluent wording |
| Can an incident be debugged? | Trace, safe correlation ID, prompt version, deployment, and error class | Your application | Raw prompt storage |
Do not put every field on every metric. Metrics need a small, controlled label set such as environment, route, model tier, operation, and outcome. Request IDs, user IDs, prompt versions, tool-call IDs, error messages, and fingerprints belong in sampled traces or access-controlled logs, not in high-cardinality metric labels.
DeepSeek Observability Reference Architecture
The model request is one span in a larger workflow. A useful trace begins when your API route, job, or agent receives work and ends only after parsing, validation, tool execution, quality checks, and response delivery. Instrumenting only the HTTP call hides the failures that matter most.
- Entry span: authenticate the request and attach a server-generated correlation ID. Never use a raw email address, phone number, prompt, or session secret.
- Prompt-build span: record template and policy versions, input-size buckets, and retrieval counts—not prompt text by default.
- DeepSeek client span: record requested model, returned model, streaming flag, terminal state, token usage, safe error class, and measured durations.
- Validation span: parse JSON or tool arguments and record only pass/fail plus a low-cardinality failure category.
- Tool spans: trace allowlist validation, authorization, execution, timeout, and result acceptance separately.
- Evaluation event: attach evaluator name, version, rubric, sample policy, and score without copying private content into the event.
- Collector boundary: redact again, drop forbidden attributes, sample deliberately, and route traces, logs, and metrics to their retention classes.
This design works whether your application uses the raw API, the OpenAI-compatible client, our DeepSeek Node.js and TypeScript guide, the DeepSeek Python SDK guide, LangChain, or LlamaIndex. Framework auto-instrumentation can reduce setup work, but the application still owns privacy policy, business validation, tool authorization, and quality definitions.
What the DeepSeek API Actually Returns
DeepSeek’s current Chat Completions contract exposes enough metadata for a strong provider span. The application should still validate optional fields and preserve a clear difference between the requested model and the model reported in the response.
| DeepSeek field or event | What it supports | Recommended telemetry treatment |
|---|---|---|
model | Model reported by the response | Record beside the requested model; alert on unexpected routing |
system_fingerprint | Backend configuration fingerprint | Keep in sampled traces if useful; never use as a metric label |
finish_reason | stop, length, content_filter, tool_calls, or insufficient_system_resource | Make terminal-state validation mandatory |
prompt_tokens | Total input tokens | Record as provider usage |
completion_tokens | Total generated tokens | Record as provider usage |
prompt_cache_hit_tokens | Input tokens served from cache | Calculate cache-hit share and estimated cache savings |
prompt_cache_miss_tokens | Input tokens not served from cache | Keep as a DeepSeek-specific usage field |
completion_tokens_details.reasoning_tokens | Reasoning-token count when available | Record the count, not reasoning text |
message.reasoning_content | Thinking-mode reasoning text | Do not log by default; expose to users only under an explicit product policy |
message.tool_calls | Requested function calls and arguments | Trace count, allowlisted name, validation, and outcome; redact arguments |
| Final streaming usage chunk | Full request usage when stream_options.include_usage is enabled | Read through the terminal sequence before closing telemetry |
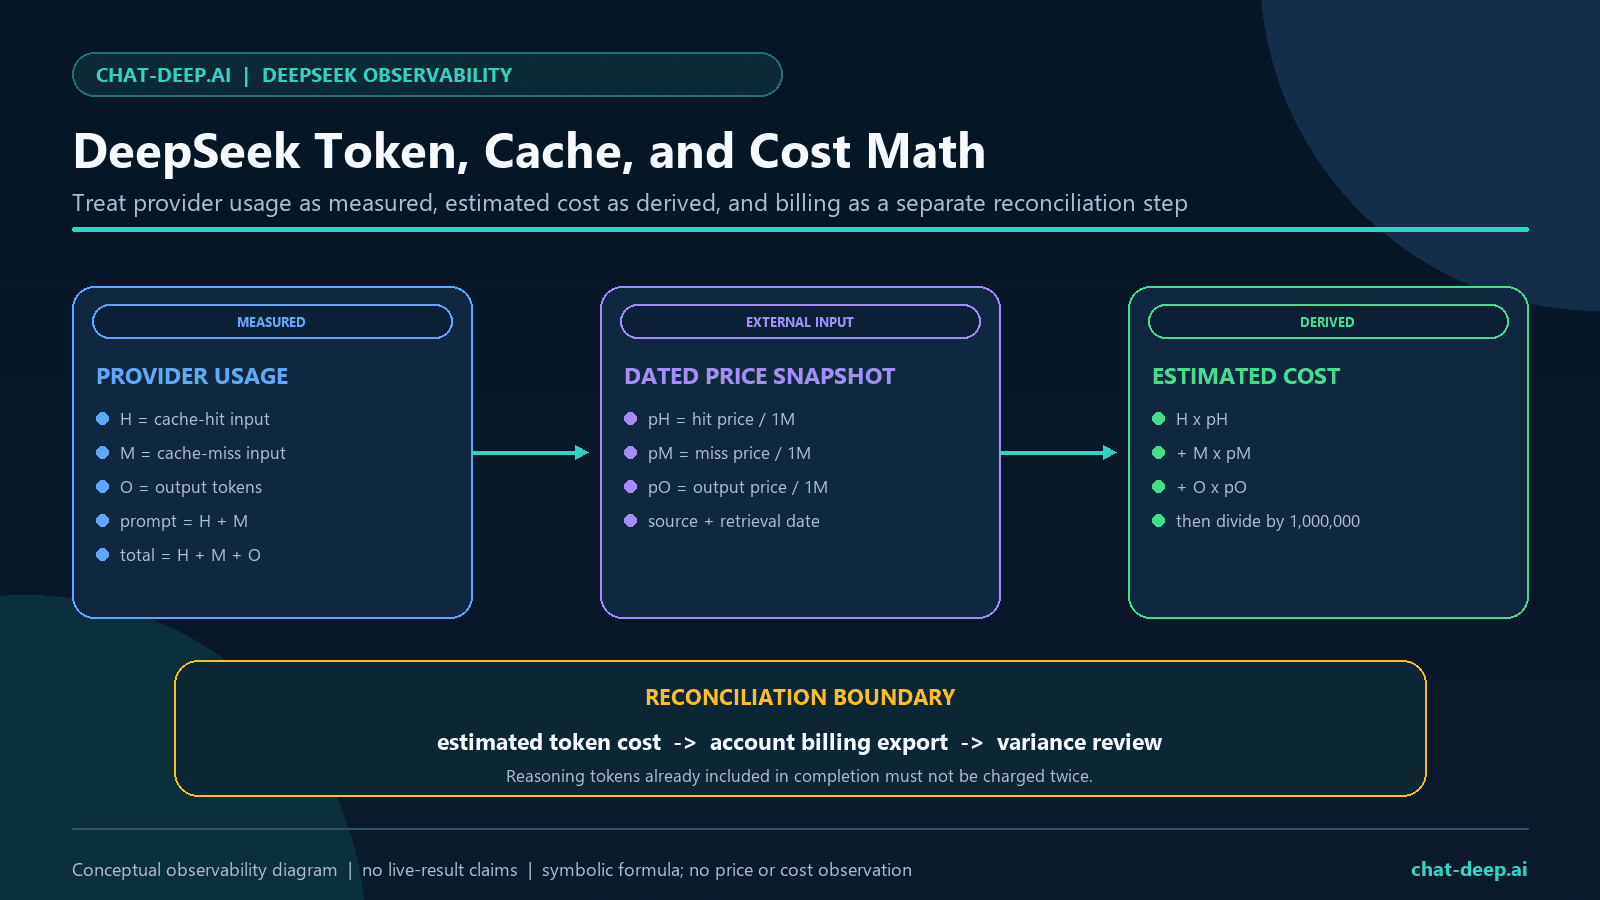
The response does not know your prompt-template version, tenant bucket, deployment, evaluation rubric, business conversion, incident ID, or current price snapshot. Add those fields at the application boundary. DeepSeek also does not return a ready-made cost number in Chat Completions; cost is an application estimate until reconciled with account billing data.
Our live /models preflight returned deepseek-v4-flash and deepseek-v4-pro. Use those canonical IDs in new code and monitor requested versus returned model separately. This is more reliable than treating an alias as a permanent product identity.
OpenTelemetry Mapping for DeepSeek
The official OpenTelemetry GenAI semantic conventions provide a portable vocabulary for model operations, tokens, streaming, tools, and evaluations. They remain versioned and under development, so pin the convention revision supported by your instrumentation and test upgrades like an API migration. The mapping below was checked against repository commit 64cfaa6; your installed library may implement a different revision.
| Signal | Current OpenTelemetry name | DeepSeek mapping |
|---|---|---|
| Operation | gen_ai.operation.name | chat |
| Provider | gen_ai.provider.name | The standardized value deepseek |
| Requested model | gen_ai.request.model | The model sent in the request |
| Returned model | gen_ai.response.model | DeepSeek response model |
| Finish state | gen_ai.response.finish_reasons | The returned finish_reason |
| Input tokens | gen_ai.usage.input_tokens | usage.prompt_tokens |
| Output tokens | gen_ai.usage.output_tokens | usage.completion_tokens |
| Cache-read input | gen_ai.usage.cache_read.input_tokens | usage.prompt_cache_hit_tokens |
| Reasoning output | gen_ai.usage.reasoning.output_tokens | completion_tokens_details.reasoning_tokens |
| Streaming request | gen_ai.request.stream | The request’s stream flag |
| First chunk | gen_ai.response.time_to_first_chunk | Seconds from request start to the first response-stream chunk received |
| Duration metric | gen_ai.client.operation.duration | Seconds through the complete client operation |
| First-chunk metric | gen_ai.client.operation.time_to_first_chunk | Histogram of first response-stream chunk observations in seconds |
| Per-output-chunk metric | gen_ai.client.operation.time_per_output_chunk | Optional streaming inter-chunk timing in seconds |
| Token metric | gen_ai.client.token.usage | Provider-reported billable token counts |
Where no standard attribute expresses a DeepSeek field, use a documented namespace such as deepseek.prompt_cache_miss_tokens. Keep custom fields out of metric labels until you have bounded their cardinality. OpenTelemetry’s content attributes and tool arguments are opt-in for a reason: they can contain personal data, secrets, proprietary context, and prompt-injection payloads.
Privacy-Safe TypeScript Wrapper
The following pattern records provider metadata and usage while leaving application contract validation to a separate internal span. It deliberately does not call recordException(error), store error.message, or attach request and response content. It assumes that your service has already registered fully initialized global OpenTelemetry tracer and meter providers, processors or readers, and exporters; the API package alone uses no-op defaults. The low-cardinality classifier should be owned and tested by your application.
import {
  SpanKind,
  SpanStatusCode,
  metrics,
  trace,
} from "@opentelemetry/api";

const tracer = trace.getTracer("deepseek-client", "1.0.0");
const meter = metrics.getMeter("deepseek-client", "1.0.0");

const duration = meter.createHistogram(
  "gen_ai.client.operation.duration",
  { unit: "s" },
);

const tokenUsage = meter.createHistogram(
  "gen_ai.client.token.usage",
  { unit: "{token}" },
);

function classifySafeError(error: unknown): string {
  const name = error instanceof Error ? error.name : "Unknown";
  if (name === "AbortError") return "cancelled";
  if (name === "TimeoutError") return "timeout";
  return "provider_or_transport";
}

function metricModel(model: string): string {
  if (model === "deepseek-v4-flash") return model;
  if (model === "deepseek-v4-pro") return model;
  return "other";
}

type SafeUsage = {
  prompt_tokens: number;
  completion_tokens: number;
  prompt_cache_hit_tokens: number;
  prompt_cache_miss_tokens: number;
  completion_tokens_details?: { reasoning_tokens?: number };
};

type SafeResult = {
  requestedModel: string;
  returnedModel: string;
  finishReason: string;
  usage: SafeUsage;
  contractValid: boolean;
};

export async function observeDeepSeek(
  route: string,
  requestedModel: string,
  call: () => Promise<SafeResult>,
): Promise<SafeResult> {
  const started = performance.now();
  let metricErrorType: string | undefined;

  return tracer.startActiveSpan(
    `chat ${requestedModel}`,
    {
      kind: SpanKind.CLIENT,
      attributes: {
        "gen_ai.operation.name": "chat",
        "gen_ai.provider.name": "deepseek",
        "gen_ai.request.model": requestedModel,
        "server.address": "api.deepseek.com",
        "server.port": 443,
        "app.route": route,
      },
    },
    async (span) => {
      try {
        const result = await call();
        const u = result.usage;

        span.setAttributes({
          "gen_ai.response.model": result.returnedModel,
          "gen_ai.response.finish_reasons": [result.finishReason],
          "gen_ai.usage.input_tokens": u.prompt_tokens,
          "gen_ai.usage.output_tokens": u.completion_tokens,
          "gen_ai.usage.cache_read.input_tokens":
            u.prompt_cache_hit_tokens,
          "gen_ai.usage.reasoning.output_tokens":
            u.completion_tokens_details?.reasoning_tokens ?? 0,
          "deepseek.prompt_cache_miss_tokens":
            u.prompt_cache_miss_tokens,
        });

        const tokenLabels = {
          "gen_ai.operation.name": "chat",
          "gen_ai.provider.name": "deepseek",
          "gen_ai.request.model": metricModel(requestedModel),
        };
        tokenUsage.record(u.prompt_tokens, {
          ...tokenLabels,
          "gen_ai.token.type": "input",
        });
        tokenUsage.record(u.completion_tokens, {
          ...tokenLabels,
          "gen_ai.token.type": "output",
        });

        return result;
      } catch (error: unknown) {
        metricErrorType = classifySafeError(error);
        span.setStatus({ code: SpanStatusCode.ERROR });
        span.setAttribute("error.type", metricErrorType);
        throw error;
      } finally {
        const metricAttributes: Record<string, string> = {
          "gen_ai.operation.name": "chat",
          "gen_ai.provider.name": "deepseek",
          "gen_ai.request.model": metricModel(requestedModel),
          "app.route": route,
        };
        if (metricErrorType) {
          metricAttributes["error.type"] = metricErrorType;
        }
        duration.record(
          (performance.now() - started) / 1000,
          metricAttributes,
        );
        span.end();
      }
    },
  );
}
Keep route on a fixed allowlist. A raw URL path containing IDs, a full user ID, or a generated model name can create expensive cardinality and expose data. The same rule applies to prompt versions: useful in traces, usually unsuitable as metric labels. Record contract validation in a separate internal validation span, event, or metric; do not mark a successful remote DeepSeek span as a provider error merely because an application-level rule failed.
Privacy-Safe DeepSeek Logs
Logging should be default-deny. Define an allowlisted event schema and reject unknown fields before export. Redaction after a raw payload reaches your log pipeline is too late: copies may already exist in buffers, error trackers, or secondary sinks.
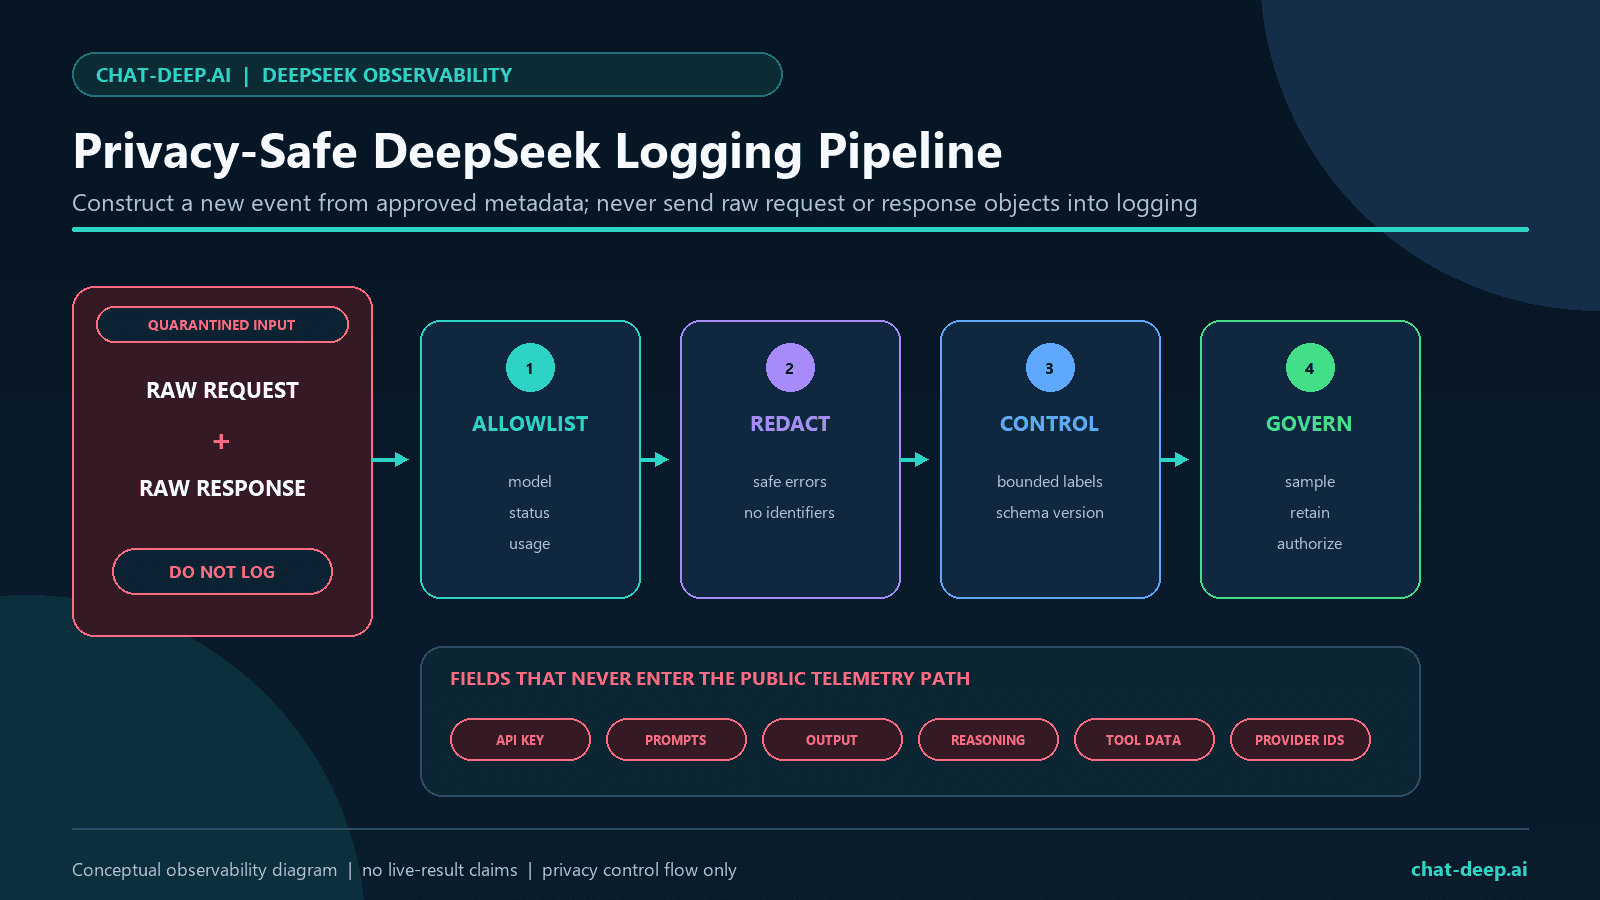
| Safe by default | Restricted or sampled | Never log by default |
|---|---|---|
| Timestamp, environment, service, route allowlist | Internal correlation ID | API key or Authorization header |
| Requested and returned model | Provider response ID under short retention | Prompt or uploaded document text |
| HTTP status and safe error class | Backend fingerprint in sampled traces | Final answer or reasoning text |
| Finish reason and validation booleans | Hashed or bucketed tenant identity | Raw tool arguments or tool result |
| Token counts and measured durations | Retrieved document IDs under access control | Raw exception message or stack with payload data |
| Retry, timeout, and cancellation state | Human feedback linked by internal ID | Cookies, headers, emails, phone numbers, or secrets |
Hashing is not magic anonymization. A stable hash of an email address can still be personal data and can create a high-cardinality metric. Prefer a server-generated opaque ID. If a legitimate workflow requires deterministic pseudonymization, use a keyed HMAC with managed secret rotation, keep it in restricted traces rather than metrics, and define retention and deletion paths; an ordinary salted hash is not enough for predictable identifiers.
{
  "event": "deepseek.chat.completed",
  "correlation_id": "internal-random-id",
  "environment": "production",
  "route": "support-summary",
  "requested_model": "deepseek-v4-flash",
  "returned_model": "deepseek-v4-flash",
  "stream": true,
  "finish_reason": "stop",
  "http_status": 200,
  "prompt_tokens": 1200,
  "completion_tokens": 180,
  "cache_hit_tokens": 1024,
  "cache_miss_tokens": 176,
  "contract_valid": true,
  "quality_sampled": false,
  "raw_content_stored": false
}
Make raw_content_stored: false an enforced invariant, not decorative metadata. A post-run audit should scan serialized evidence for secret patterns, provider IDs, prompt/output fields, non-allowlisted keys, and accidental Unicode content before publication. Our DeepSeek API Key guide covers server-only credential storage and revocation.
DeepSeek Streaming Observability
Streaming needs more than one latency number. DeepSeek uses server-sent events and can send keep-alive comments while a request waits. A keep-alive proves that the connection is alive; it is not a model chunk, a token, or visible content.
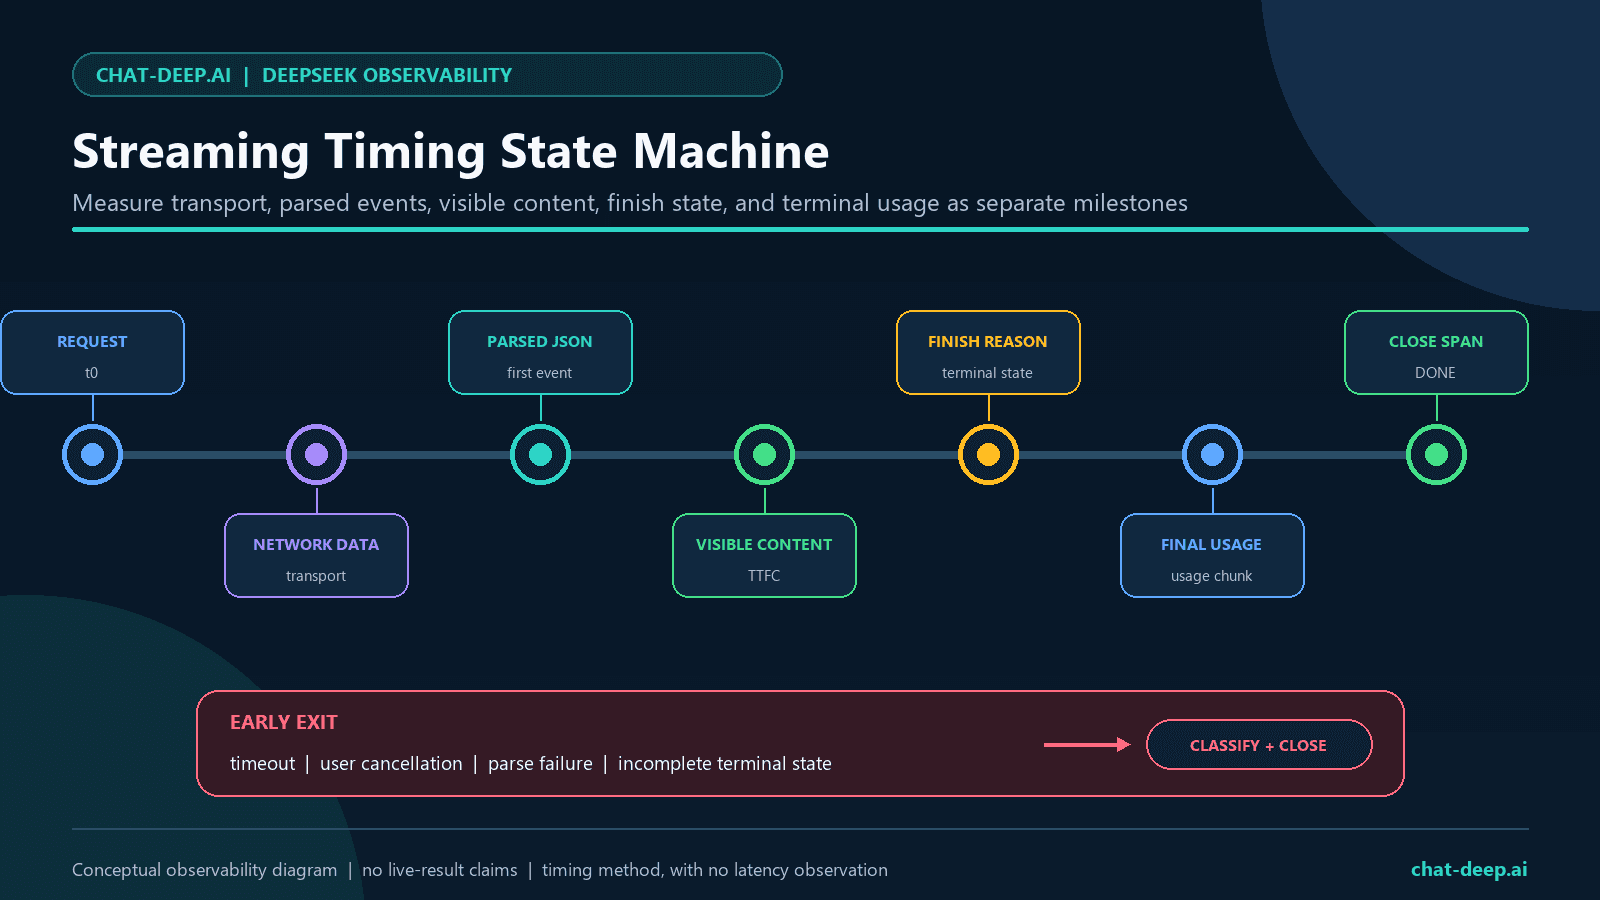
- Time to first network data: useful for transport diagnosis, but it may be an empty line or keep-alive.
- Time to first response-stream chunk: the current OpenTelemetry GenAI first-chunk concept.
- Time to first parsed JSON event: an application-specific parser measurement that can differ from the stream-chunk boundary.
- Time to first content: when the user can see final-answer content. Thinking metadata may arrive earlier.
- Time to terminal reason: when the stream declares
stop,length,tool_calls, or another finish state. - Time to final usage: when the usage chunk is observed with
stream_options.include_usage: true. - Time to cleanup: when the reader, abort signal, buffers, and span are closed.
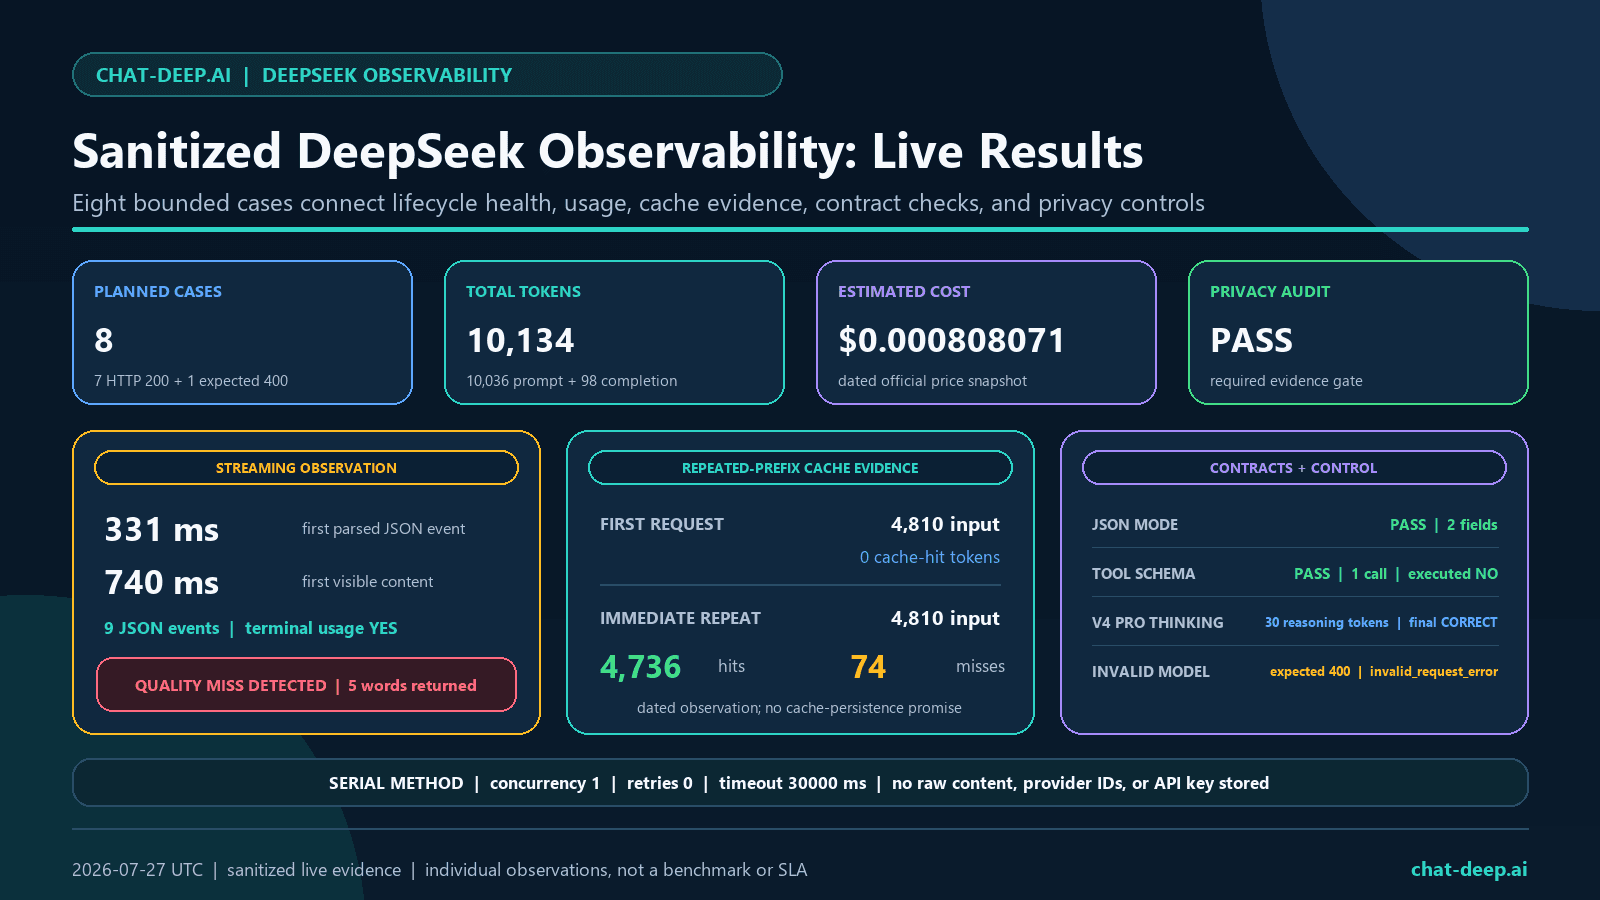
In our one-run stream observation, the first response-stream data chunk and first parsed JSON event were both observed at 331 ms, while the first content arrived at 740 ms. The stream contained nine parsed JSON events, finished with stop, and included terminal usage. These numbers describe one dated request from one test environment; they are not averages, percentiles, throughput measurements, or a DeepSeek SLA.
The quality check still failed because the output contained five words instead of the requested six. That failure should increment a task-contract metric even though transport, streaming, terminal state, and usage collection all succeeded.
DeepSeek Token, Cache, and Cost Monitoring
Use the provider’s returned token counts. DeepSeek states that prompt_tokens equals cache-hit plus cache-miss input tokens. Do not replace those fields with a character estimate when billable usage is available.
A per-request cache-hit share is:
cache_hit_share =
  prompt_cache_hit_tokens / prompt_tokens
Estimated request cost must use a dated price table because prices can change:
estimated_cost =
  (
    cache_hit_tokens * cache_hit_input_rate_per_million
    + cache_miss_tokens * cache_miss_input_rate_per_million
    + completion_tokens * output_rate_per_million
  ) / 1_000_000
The official DeepSeek pricing page checked for this study listed the following USD rates per one million tokens:
| Model | Cache-hit input | Cache-miss input | Output |
|---|---|---|---|
deepseek-v4-flash | $0.0028 | $0.14 | $0.28 |
deepseek-v4-pro | $0.003625 | $0.435 | $0.87 |
Original Cache Observation
We sent the same synthetic 4,810-token prefix twice in immediate succession. The first request reported zero cache-hit tokens. The second reported 4,736 cache-hit tokens and 74 cache-miss tokens—a 98.4615% hit share for that request. At the price snapshot above, the first request’s estimated cost was $0.000674240 and the immediate repeat was $0.000024461, about 96.37% lower.
This is a controlled demonstration, not a cache-persistence promise. It does not establish how long a prefix remains reusable, how another account behaves, or what hit share a changing production prompt will achieve. Monitor your own prefix versions and compare stable cohorts.
For a deeper implementation, use our DeepSeek Context Caching guide. Keep price rates in configuration with an effective date and source URL, and reconcile estimated monthly spend against the DeepSeek platform’s usage or billing export.
DeepSeek Quality and Contract Monitoring
Quality is not one universal score. Define checks that match the job. A customer-support summarizer may need groundedness and omission tests; a DeepSeek JSON Output endpoint needs parse, schema, and business-rule checks; a coding assistant needs compilation and unit tests; an agent needs correct tool selection, authorized arguments, and a valid terminal answer.
| Layer | Example check | Useful result | Unsafe shortcut |
|---|---|---|---|
| Terminal state | Require the expected finish_reason | Complete, truncated, filtered, tool call, or resource interruption | Accept any HTTP 200 |
| Syntax | Parse JSON | Boolean plus safe error class | Log malformed output |
| Schema | Validate required fields and types | Schema version and pass/fail | Trust TypeScript types at runtime |
| Business rule | Check allowlists, ranges, and permissions | Rule ID and pass/fail | Let the model authorize an action |
| Task constraint | Exact word count, citation count, or required section | Deterministic compliance result | Use fluency as correctness |
| Groundedness | Compare claims with supplied evidence | Versioned rubric, score, and sample policy | Ask the same model if it is correct |
| Human outcome | Accepted edit, resolved ticket, or reviewer score | Delayed product signal | Optimize only automated scores |
Sample expensive evaluators instead of running them blindly on every request. Keep an always-on deterministic layer for finish state, JSON, tool schema, citations, and policy flags; add offline regression suites for releases; then apply human or model-based evaluation to a stratified sample. Version every prompt, dataset, judge, rubric, threshold, and model used for evaluation.
The companion DeepSeek Evaluation Framework covers release gates and regression design. Observability consumes those evaluation results; it should not silently redefine the scoring method.
DeepSeek Thinking, Tools, and Agent Traces
DeepSeek Thinking Mode adds another output lane. Record whether reasoning was requested, whether reasoning metadata was present, the reasoning-token count, final-content presence, and the terminal state. Do not treat nonempty reasoning as a complete answer, and do not export reasoning text to ordinary logs.
Our V4 Pro control returned a normal stop, 30 reasoning tokens, and the correct final integer. That proves those fields were observable in that request; it does not justify logging the reasoning text or assuming every thinking request will finish inside the same token budget.
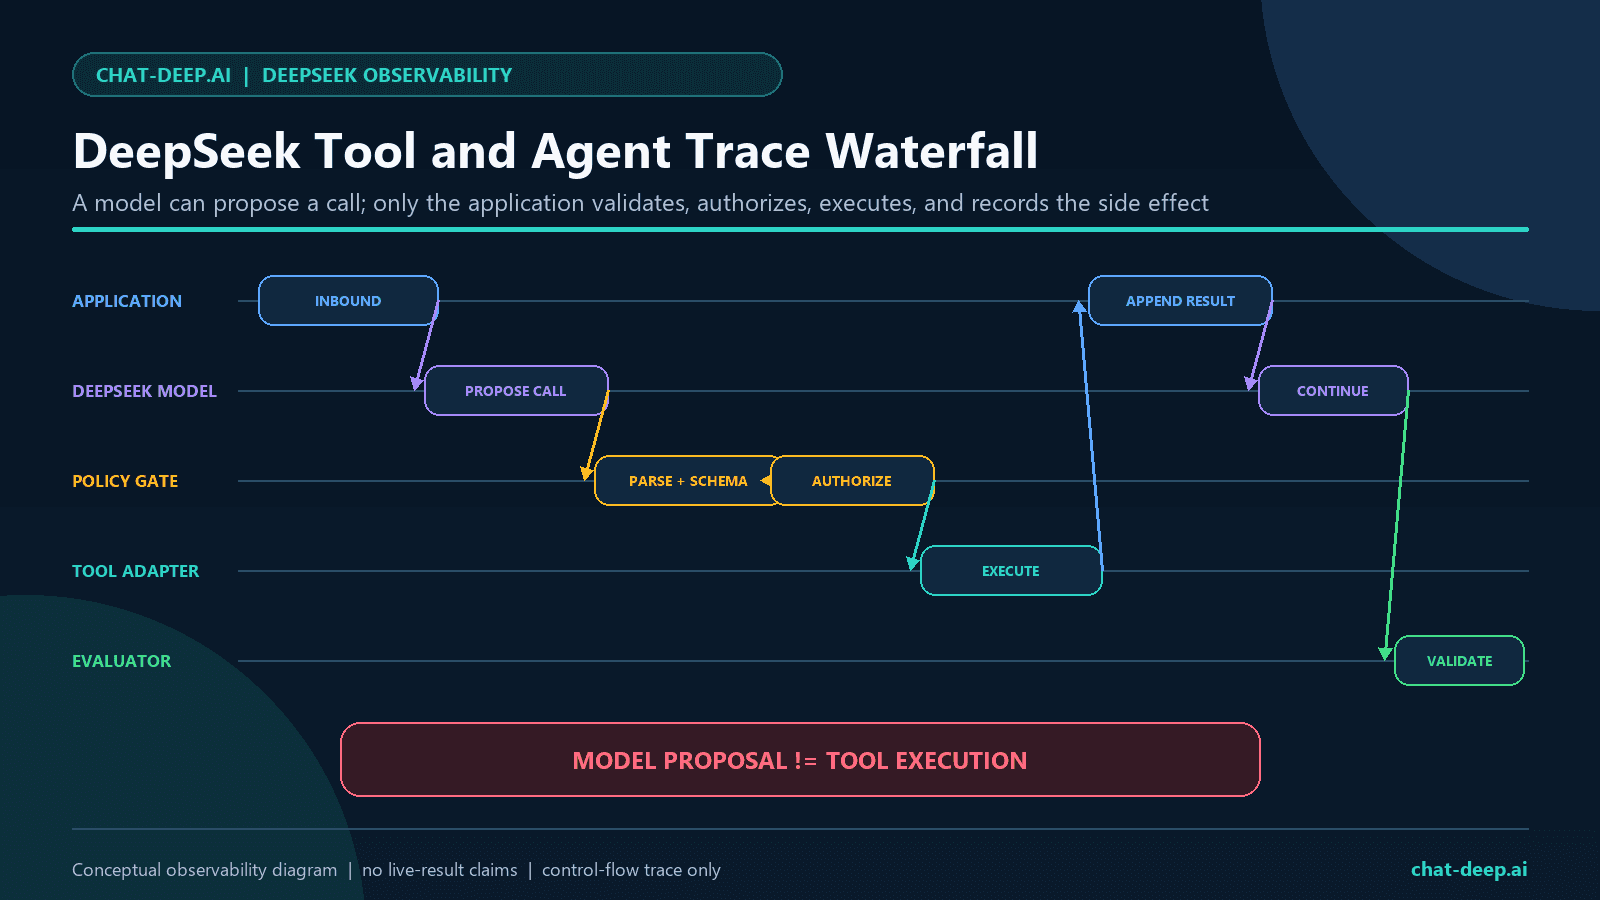
- Start the model-call span and record the allowlisted tool-set version.
- Record tool-call count and allowlisted tool name; keep raw arguments out of default telemetry.
- Parse arguments as untrusted input and record syntax/schema outcomes.
- Authorize the requested action against the current user and tenant policy.
- Execute a bounded adapter with its own timeout, retry, and side-effect policy.
- Return a tool result with the correct call ID inside the model protocol.
- Validate the continuation’s final state and output contract.
In our required-tool live case, DeepSeek returned one get_service_health call with valid JSON and the allowed synthetic service value. We did not execute a real tool because the test’s purpose was observability of the proposal and validation boundary. The result is evidence for that narrow contract, not a production authorization test. See the DeepSeek Tool Calls guide for the complete application loop.
DeepSeek Errors, Retries, Timeouts, and Concurrency
Classify errors before alerting or retrying. DeepSeek’s current error documentation lists 400, 401, 402, 422, 429, 500, and 503 outcomes. Your telemetry should also distinguish client timeout, user cancellation, stream parse failure, incomplete terminal state, JSON failure, tool validation failure, and business-policy rejection.
| Class | Retry? | Observability fields | Alert route |
|---|---|---|---|
| 400 / 422 request contract | No until code or input is fixed | Safe validation category, release, prompt/tool schema version | Owning engineering team |
| 401 authentication | No automatic retry | Credential identifier alias, not the key | Security or platform on-call |
| 402 balance | No until account state changes | Account alias and billing state | Billing owner |
| 429 concurrency limit | Bounded backoff if the operation is safe | In-flight count, queue depth, model, attempt | Capacity and application owner |
| 500 / 503 provider failure | Bounded retry for idempotent work | Error class, attempt, elapsed budget, fallback state | Provider dependency incident |
| Timeout or cancellation | Policy-dependent; never retry a user cancellation | Timeout owner, phase, abort source, side-effect state | Application owner |
| Contract or quality failure | Repair only under a bounded, measured policy | Validator/evaluator version and failure class | Product quality owner |
Choose one retry owner. If the SDK, gateway, worker, and job queue all retry, one user action can multiply into many billable calls and duplicate side effects. Record attempt, retry_owner, elapsed_budget_ms, and an internal deduplication key, then verify that cancellation stops pending work.
DeepSeek’s Rate Limit and Isolation page checked for this guide listed account-level concurrency of 2,500 for V4 Flash and 500 for V4 Pro. These are concurrency limits, not published RPM or TPM quotas. Track your own in-flight gauge and queue age because the response does not expose account saturation. The same documentation says user_id must not contain private information; use an opaque internal value and do not turn it into a metric label.
DeepSeek may send empty lines for non-streaming waits and SSE keep-alive comments for streaming waits. Your parser must ignore them without resetting the entire business timeout indefinitely. Measure queue-wait indicators separately and set an application timeout that fits your user experience and retry budget. Our DeepSeek Error Codes and DeepSeek API Rate Limits pages cover those boundaries in more detail.
DeepSeek Dashboard and Incident Alert Design
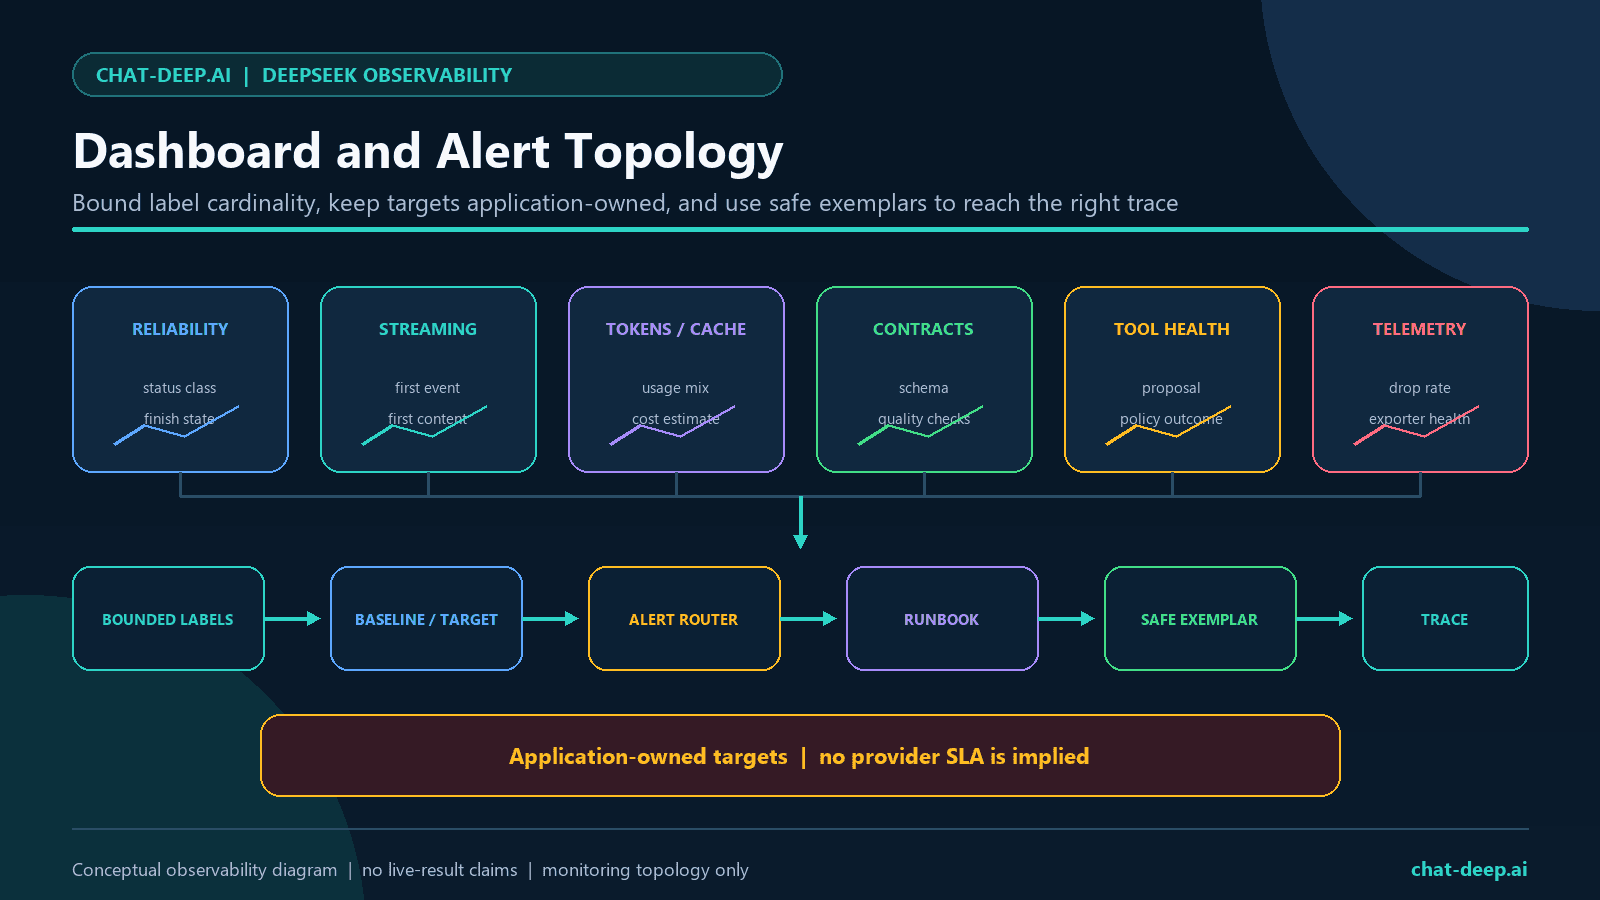
A dashboard should lead from symptom to trace. Put a small set of service-level indicators at the top, then provide drill-down panels for tokens, cache, cost, contracts, tools, and telemetry health. Do not mix unrelated populations: separate environment, route, streaming mode, canonical model, and release when those dimensions change behavior.
Recommended Dashboard Panels
- Reliability: request count, operational success, terminal-complete rate, 4xx/5xx by safe class, timeouts, cancellations, and retry amplification.
- Streaming: first-chunk and first-content distributions, complete-stream rate, terminal-usage rate, client aborts, and orphaned streams.
- Usage and cost: input, output, cache-read, cache-miss, and reasoning tokens; estimated spend by route and model; billing reconciliation difference.
- Quality: deterministic contract pass rate, sampled evaluator scores, human feedback, and business outcome by prompt/release cohort.
- Tools and agents: calls per run, validation failures, authorization denials, tool timeouts, side-effect retries, and final-answer completion.
- Telemetry health: collector drops, export failures, sampling rate, missing usage, missing terminal states, redaction rejects, and clock skew.
Starting Alert Policies
The following are policy shapes, not universal thresholds. Establish a baseline and error budget for each route before choosing numbers.
| Alert | Condition shape | Guardrail |
|---|---|---|
| Provider dependency | 5xx or 503 rate exceeds the route’s short-window budget | Require minimum traffic and compare with official status |
| Concurrency pressure | 429 rate, in-flight gauge, and queue age rise together | Do not infer RPM/TPM from a concurrency error |
| Streaming regression | First-chunk or first-content percentile departs from baseline | Separate network, keep-alive, parsed chunk, and content |
| Incomplete outputs | length, content filter, resource interruption, or empty final answer rises | Group by request budget and model |
| Cost anomaly | Token or estimated-cost burn exceeds a cohort forecast | Pin the price snapshot and reconcile billing |
| Cache regression | Hit share drops after a prompt/template release | Compare like-for-like prefix cohorts |
| Quality regression | Contract or sampled evaluation rate falls below its release budget | Version the evaluator and watch sample size |
| Telemetry blind spot | Usage, terminal state, or export coverage falls | Alert on missing evidence, not only bad evidence |
Link provider incidents to DeepSeek’s official status page, but do not wait for an external status update before protecting users. Your own measured error budget and fallback policy should control application behavior.
Original DeepSeek Observability Live Test Results
We froze the plan before any paid generation request. The run used concurrency one, zero provider retries, a 30-second per-request timeout, synthetic English-only prompts, and no real tools or user data. Raw prompts, outputs, reasoning text, provider IDs, raw errors, and the API key were excluded from public artifacts. The temporary key existed only in memory and was revoked after the run.
| Case | Observed outcome | What the monitor proved |
|---|---|---|
| Ordinary V4 Flash | 200, stop, exact output, usage present | Provider lifecycle and deterministic contract |
| Streaming V4 Flash | 200, nine JSON events, terminal usage, five words instead of six | Streaming health can pass while task quality fails |
| JSON mode | 200, valid JSON, exact two-field schema | Parse and schema gates |
| Required tool call | 200, tool_calls, one valid allowlisted call | Proposal, count, name, and argument validation |
| V4 Pro thinking | 200, stop, reasoning usage, correct final answer | Separate reasoning metadata and final completion |
| Cache request one | 4,810 input tokens; zero hits | Cold observation for the controlled prefix |
| Immediate cache repeat | 4,736 hits and 74 misses | Provider-returned cache telemetry and cost calculation |
| Invalid model control | Expected 400, invalid_request_error | Safe error classification |
Across the seven successful generation requests, DeepSeek reported 10,036 prompt tokens, 98 completion tokens, and 10,134 total tokens. Using the dated official prices, the study’s estimated token cost was $0.000808071. The models preflight returned only the two canonical V4 IDs. Every planned outcome was observed, including the expected error and the deliberately independent quality failure.
Open the public reproducibility package on GitHub for the frozen plan, source, fixtures, local tests, sanitized result files, privacy audit, and editable SVG visuals. The repository contains synthetic test prompts needed for reproduction, but no private prompts, raw provider outputs, provider IDs, API keys, account balances, or tool side effects.
Study Limitations
- One serial request per scenario cannot establish a latency distribution, throughput limit, availability rate, or SLA.
- The immediate repeated-prefix test does not measure cache persistence or cross-user behavior.
- The six-word rule is one deterministic contract, not a general quality score.
- The tool test validated a synthetic proposal and did not execute a business action.
- Prices, model IDs, limits, and semantic conventions are time-sensitive and must be rechecked.
DeepSeek Observability Implementation Checklist
- Define operational, terminal, contract, quality, safety, and business success separately.
- Generate an internal correlation ID and propagate trace context through retrieval, DeepSeek, tools, and evaluation.
- Pin your OpenTelemetry GenAI convention version and regression-test upgrades.
- Record requested model, returned model, streaming flag, finish reason, safe error class, and usage.
- Measure first network data, first response-stream chunk, first parsed event, first content, terminal state, final usage, and cleanup separately.
- Validate JSON, tool arguments, citations, business rules, and terminal state before calling the result successful.
- Keep prompts, outputs, reasoning text, tool arguments, credentials, headers, provider IDs, and raw errors out of default telemetry.
- Use low-cardinality metric labels; keep request-level identifiers in sampled traces.
- Calculate cost from provider usage plus a dated price snapshot and reconcile against billing.
- Choose one retry owner and record attempt, timeout owner, cancellation source, and side-effect state.
- Build separate dashboard panels for reliability, streaming, tokens/cache/cost, quality, tools, and telemetry health.
- Run a privacy audit on exported evidence and alert when expected telemetry disappears.
DeepSeek Observability FAQ
Does DeepSeek export OpenTelemetry traces natively?
The Chat Completions response supplies model, finish, usage, cache, reasoning, and tool metadata; it does not by itself export your end-to-end application trace. Instrument the client boundary or use a tested framework/gateway integration, then add your own prompt-build, retrieval, validation, tool, evaluation, and business spans.
Should I log DeepSeek prompts and responses?
Not by default. They can contain personal data, secrets, proprietary material, retrieved documents, and injection payloads. Start with metadata-only telemetry. If a narrowly defined debugging or evaluation workflow needs content, require explicit approval, minimization, redaction, encryption, access control, short retention, deletion support, and an auditable sampling policy.
How should I measure DeepSeek TTFT?
Define the term. Measure time to first network data, first response-stream chunk, first parsed model event, and first visible content separately. Ignore empty lines and SSE keep-alive comments as model output. OpenTelemetry’s current client metric uses the first response-stream chunk, while parser diagnostics and user experience may care more about the first parsed event and first visible content.
Which DeepSeek token fields should I monitor?
Record prompt_tokens, completion_tokens, total_tokens, prompt_cache_hit_tokens, prompt_cache_miss_tokens, and reasoning tokens when present. Validate that hit plus miss equals prompt tokens before using the event for cost calculations.
Does HTTP 200 mean the DeepSeek answer is good?
No. It means the transport produced a successful HTTP response. You still need terminal-state, parse, schema, business-rule, safety, quality, and outcome checks. Our live streaming case returned 200 and stop but failed its six-word task constraint.
How do I monitor DeepSeek cost?
Multiply provider-reported cache-hit input, cache-miss input, and output tokens by the matching dated model rates. Store the price version and source URL with the estimate, then reconcile aggregates with account billing. Do not hard-code an undated price into dashboards or treat the estimate as an invoice.
What DeepSeek alerts should I create first?
Start with provider error budget, timeout/cancellation rate, incomplete terminal states, missing usage, missing telemetry, deterministic contract failure, token/cost burn, cache-hit regression, and retry amplification. Add sampled quality alerts after the evaluator, baseline, and minimum sample size are reliable.
Methodology and Sources
Documentation and pricing were reviewed July 27, 2026 UTC. Provider claims come from DeepSeek’s official Chat Completions API, Models and Pricing, Rate Limit and Isolation, Error Codes, and Context Caching pages. Telemetry names and privacy guidance come from the official OpenTelemetry GenAI semantic conventions project and OpenTelemetry’s GenAI observability guidance.
Every live figure in this article is a dated observation from the frozen plan, not a claim about future availability, performance, cache persistence, or service level. Re-run the harness in your own region, network, account, workload, and release process before setting production budgets or alerts.